This tutorial proposes some general SPSS best practices. Some should go without saying but I see these things go wrong on a daily basis. The result is loss of time and effort and -worse- joy and motivation. So for a smooth and rewarding experience, try to
1. Keep Things Organized
Getting a project done with SPSS may involve some trial and error. You may create variables or files that you don't really want to use. You may rerun some output and give it a different file name. Like so, your project may tend to become a big mess. If it does, the fastest way out may be to start all over.
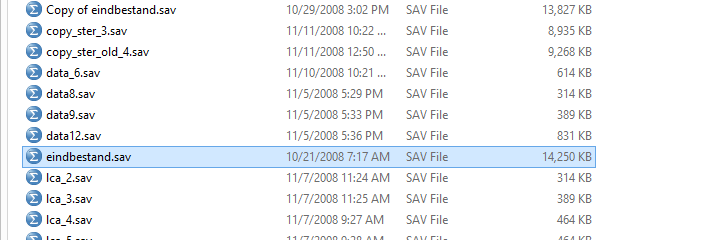 Messed up project: way too many files with names that don't say much.
Some basic tips for keeping things organized are:
- Keep all files -data, syntax, output and other- together in one project folder.
- Make a (.zip) backup of this folder on a regular basis and upload it to the cloud.
- Number your data, syntax and output files, preferably with tenfolds.
- Use short variable names. Detailed descriptions should go into variable labels, not names.
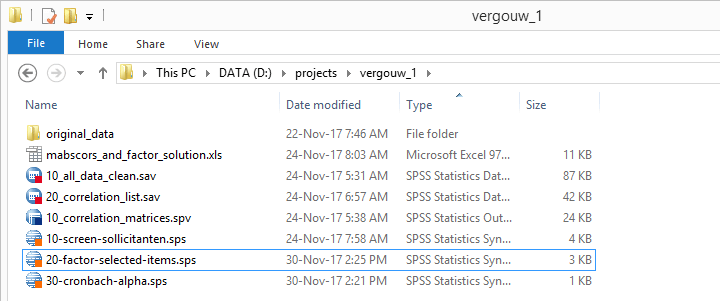 Keeping this project nicely organized saved me way more time than it cost me.
2. Work from Syntax
Working from syntax is probably the single best SPSS practice. The very basic reason is that you can save syntax but you can't save mouse clicks. Not working from syntax -or not keeping it tidy- may cost you days of work if something goes wrong. Besides, if somebody disagrees with your outcomes, you've no means whatsoever to prove you did things right. For a more elaborate discussion on this, see SPSS Syntax - Six Reasons you Should Use it.
3. Don't Trust Your Data
An important best practice is to
hunt down every issue that could possibly jeopardize your data.
And if you do detect any issues, don't fix them later. Fix them right here, right now. After editing variables, check the results very carefully. A tool that facilitates this is our SPSS Clone Variables Tool.
Scrutinously inspecting your data doesn't only save time and effort. Perhaps more importantly, it'll give you confidence and contribute to a rewarding experience.
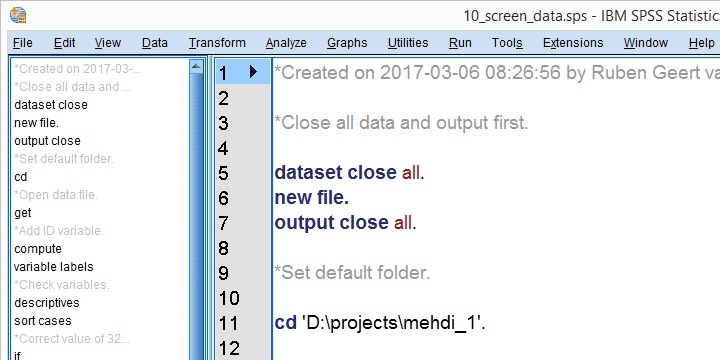
 Check your variables for unlikely values before editing or analyzing them.
4. Create Charts
So what's so great about charts? Well, for 2 things:
- charts give more insight into your data and
- charts give faster insight into your data.
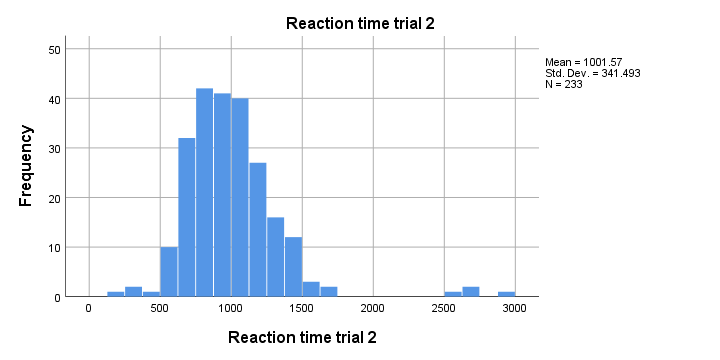
If you're not sure about using charts, try to accurately describe what the chart below tells about our data.
 Which numbers and words could replace this chart?
Creating charts in SPSS is easy, especially if you use the legacy dialogs rather than the chart builder. Starting from SPSS 25, charts look much better as discussed in New Charts in SPSS 25 - How Good Are They Really?
Importantly, don't forget about chart templates either.
5. Avoid Manual Work
We all too often see SPSS users spend hours on repetitive manual tasks. We recommend you try and avoid doing so at all times because
- manual work is error prone;
- manual work is not replicable;
- manual work is often a waste of time, effort and joy.
Whenever you think “there must be a faster way to do this”, you're usually right. Some general time savers are
- OUTPUT MODIFY for batch editing a selection of output tables;
- OMS for converting output tables into SPSS datasets;
- tablelooks and chart templates for styling tables and charts;
- DO REPEAT, VECTOR and LOOP for looping over variables or values.
If none of those help, Python for SPSS can automate basically anything that can possibly be automated.
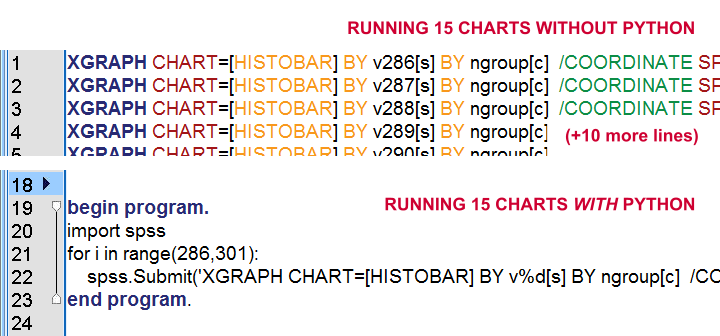 SPSS Python syntax example
Final Notes
Over the years, I've seen many SPSS users make the same basic mistakes over and over again. This often results from some things not being obvious. Especially working from syntax may seem overly slow and complicated at first glance. Also, one can't expect beginners to figure out the handy tricks that are sometimes well hidden in SPSS’ huge menu.
You can avoid the worst beginners’ mistakes by sticking to the 5 best practices proposed in this lesson. But if you disagree, feel free to ignore them.
Thanks for reading!