- Summary
- Wrong Covariances from FACTOR
- Correct Covariances from CORRELATIONS
- Correct Covariances from REGRESSION
Summary
When using pairwise exclusion of missing values, SPSS FACTOR computes wrong covariances. For correct covariances, use
- CORRELATIONS (menu or syntax) or
- REGRESSION (syntax only).
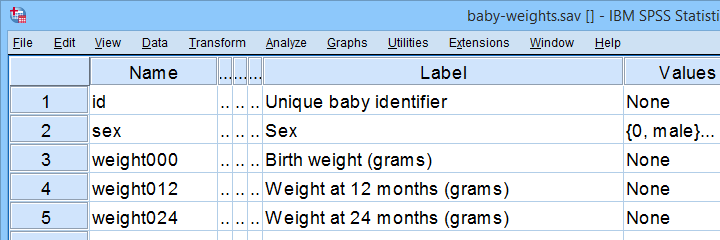
This tutorial presents a quick comparison of these 3 methods. We'll use baby-weights.sav -partly shown below- for all examples.
Wrong Covariances from FACTOR
Right. So let's compute the covariance matrix for weight000 through weight036 by using FACTOR. The SPSS syntax below does so using pairwise exclusion of missing values.
factor
/variables weight000 to weight036
/missing pairwise
/print correlation covariance.
Result
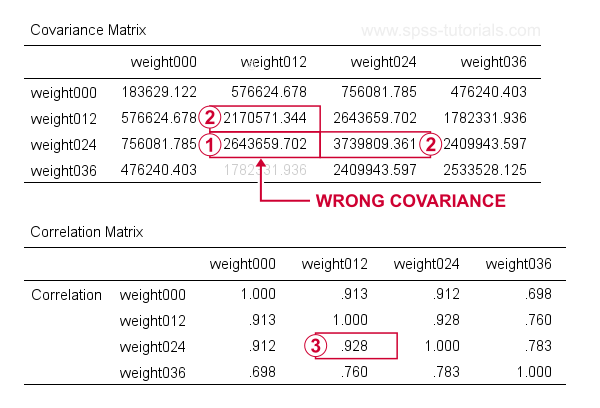
At first, these results look perfect. Now, let's recompute  the covariance between weight012 and weigh024 from
  the variances and
  the correlation for these variables by using
$$S_{xy} = r_{xy} \cdot s_x \cdot s_y$$
where
- \(S_{xy}\) denotes the (sample) covariance between variables \(X\) and \(Y\);
- \(r_{xy}\) denotes the (Pearson) correlation between \(X\) and \(Y\);
- \(s_x\) and \(s_y\) denote the (sample) standard deviations of \(X\) and \(Y\).
This gives
$$S_{xy} = 0.928 \cdot \sqrt{2170571} \cdot \sqrt{3739809} = 2643660$$
which is indeed what SPSS reports here. So how could this possibly be wrong? Our second approach will clarify just that and come up with different -but correct- results.
Correct Covariances from CORRELATIONS
The only way to obtain covariances from SPSS’ menu is by navigating to
![]()
![]() as shown below.
as shown below.
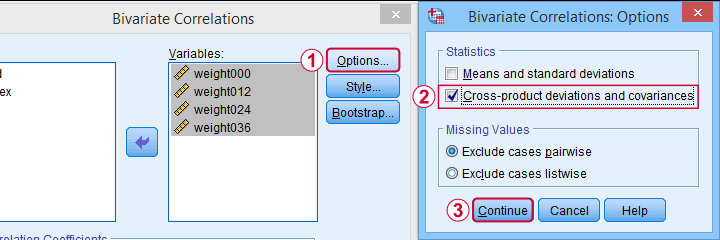
This results in the syntax below. Let's run it.
CORRELATIONS
/VARIABLES=weight000 weight012 weight024 weight036
/PRINT=TWOTAIL NOSIG FULL
/STATISTICS XPROD
/MISSING=PAIRWISE.
Result
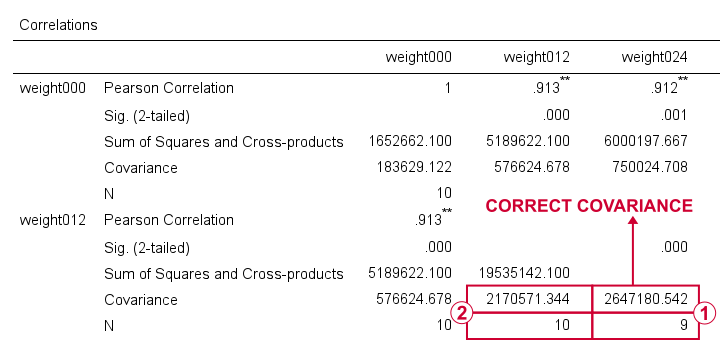
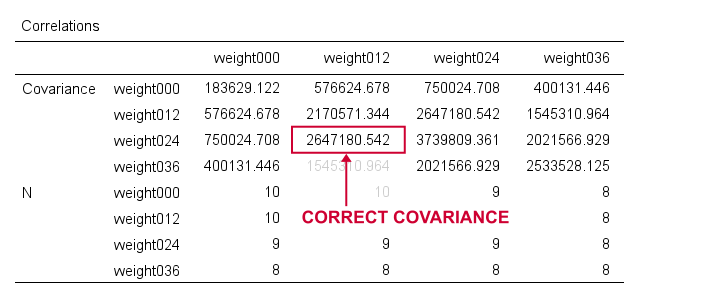
For weight012 and weight024, SPSS reports \(S_{xy}\) = 2647181. Note that this is based on a subsample of N = 9 cases due to pairwise exclusion of missing values.
The variance for weight012, however, is based on a different subsample of N = 10...
...and that's why the previous results were wrong. FACTOR seems to compute each covariance from a correlation and two variances that may all be based on different subsamples!
CORRELATIONS, however, correctly computes all components for a covariance on the same subsample: all cases having valid values on both variables. Alternative software such as Excel and Googlesheets also comply with this approach.
I think these results provide sufficient evidence for my claim that FACTOR may compute wrong covariances. Nevertheless, let's see what our third -and best- method for obtaining covariances comes up with...
Correct Covariances from REGRESSION
The syntax below illustrates how to obtain covariances and the sample sizes they're based on via REGRESSION.
regression
/missing pairwise
/dependent weight000
/method enter weight012 to weight036
/descriptives n cov.
Result
Although the multiple regression results aren't helpful, the previous syntax does result in a nice and clean covariance matrix as shown below.
First off, note that REGRESSION comes up with the same (correct) covariances as CORRELATIONS. So that makes 1 against 2 -or more if we take Excel and/or Googlesheets into account.
Second, note that REGRESSION results in a convenient table layout that's sorted by statistic rather than by variable. This usually comes in handy for further processing such as
- computing Cronbach’s alpha or
- some kind of factor analysis.
So that's basically it. Let me know what you think by throwing in a comment below. We always appreciate some feedback. Also if you think our tutorials totally suck.
Thanks for reading!
THIS TUTORIAL HAS 8 COMMENTS:
By Ruben Geert van den Berg on October 1st, 2021
Hi Jon!
I hope this'll be changed indeed.
If different formulas are used on purpose, then SPSS should at least add a footnote to the table to point this out. Or perhaps even let the user choose which formula to use.
Simply reporting different covariances computed on the same data as "covariance" seems rather awkward at best.
If 2 analysts report different covariances due to different formulas in SPSS, they'll have a hard time figuring out why their results don't match...
By Ruben Geert van den Berg on October 1st, 2021
Hi Rick, thanks for you comment!
Interesting that the issue was discussed in Little and Rubin.
But as I suggested in a different comment: if different formulas are used on purpose, then SPSS should at least add a footnote to the table to point this out, right?
Simply reporting different covariances computed on the same data as "covariance" is asking for trouble and confusion among analysts using these different methods. So if both covariances themselves are technically correct, then the reporting by SPSS is still not good.
P.s. Jon Peck told me that there's going to be some change to SPSS regarding this issue. I hope it'll be resolved wisely!
By Rick M on October 1st, 2021
Yes, it will be changed. :)