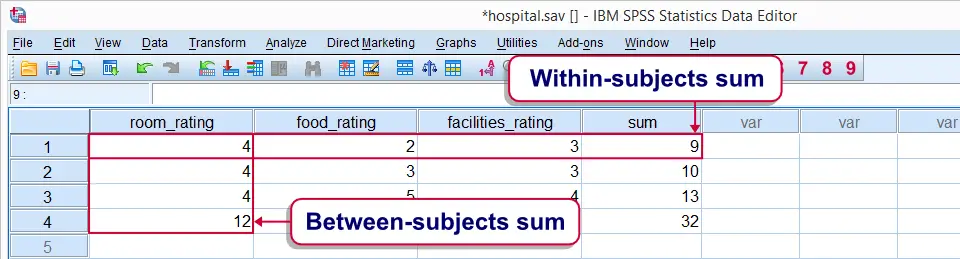
This tutorial walks you through SPSS' main statistical functions. They are mainly used with COMPUTE and IF. Note that these are all within-subjects (or “horizontal”) functions.
For between-subjects (or “vertical”) functions, see AGGREGATE.
All examples in this tutorial use hospital.sav, which is freely downloadable.
 Within-subjects versus between-subjects functions.
SPSS Statistical Functions - Missing Values
SPSS statistical functions only return system missing values if all their input values are missing values. If a single input value is valid, the output value will be valid too. This holds for all functions we'll cover in this tutorial.
Remember that the opposite holds for SPSS numeric functions: the latter only return a valid value if all their input values are valid.
SPSS Statistical Functions - Dot Operator
A minimal number of valid input values can be specified for statistical functions. This is done by suffixing the function with a period followed by the required number of valid values. For example
compute mean_v = mean.3(v1 to v5).
means “Compute mean_v only for cases having at least 3 valid values over v1 to v5. Cases with fewer valid values must get a system missing value on mean_v.”
The dot operator can be used with all functions covered in this tutorial. Don't overlook it. Although it's little known among SPSS users, it's a terrific time saving feature.
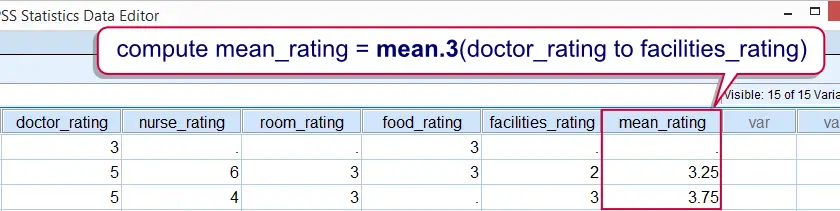 Compute mean only for cases with at least 3 valid values on the input variables
Data Preparation
We'll use only the last 5 variables in our data.Strictly, calculations are not allowed on such ordinal variables. However, see Assumption of Equal Intervals. The functions we'll demonstrate on them may return incorrect values if we fail to specify user missing values. We'll therefore do a quick check by running FREQUENCIES with the syntax below. Note the TO keyword in step 5.
cd 'd:/temp'.
*2. Open data file.
get file 'hospital.sav'.
*3. Show values and value labels in output.
set tnumbers both.
*4. Inspect frequencies.
frequencies doctor_rating to facilities_rating.
*5. Specify 6 as user missing value for all variables involved.
missing values doctor_rating to facilities_rating(6).
SPSS MEAN Function
Means over variables are returned by SPSS MEAN function. If missing values are present, the sum of the valid values is divided by the number of valid values. The syntax below shows how to compute within-subjects means.
compute mean_rating = mean(doctor_rating to facilities_rating).
exe.
SPSS SUM Function
SPSS SUM function returns the sum over a number of variables. In the presence of missing values, the sum over all valid values is returned. Keep in mind that the result may be somewhat misleading in this case.Also see SPSS Sum - Cautionary Note. The syntax below computes the within-subjects sum over our rating variables.
compute sum_rating = sum(doctor_rating to facilities_rating).
exe.
SPSS MIN Function
The minimum (smallest value) over a number of values is returned by SPSS MIN function. We normally use MIN for numeric variables but it can technically be used on string variables as well. It's demonstrated on our rating variables by the syntax below.
compute min_rating = min(doctor_rating to facilities_rating).
exe.
SPSS MAX Function
SPSS MAX function returns the maximum (largest value) over a number of values. Just like MIN, it can be used on string variables too. The syntax below computes the maximum over the rating variables.
compute max_rating = max(doctor_rating to facilities_rating).
exe.
SPSS SD Function
The standard deviation over a number of variables is returned by SPSS SD function. Keep in mind that we're referring to the within-subjects standard deviation here.SPSS divides by (n-1) when computing the standard deviation.
Computing within-subjects standard deviations comes in handy in survey research for detecting straightliners: respondents who give the same answer to all questions will have a standard deviation of zero over these questions. This may be an indication that the questions weren't answered seriously, in which case you may want to exclude such cases from analysis.See SELECT IF and FILTER for the most likely options here.
SPSS SD Function Syntax Example
compute sd_rating = sd(doctor_rating to facilities_rating).
exe.
*2. Move straightliners to top of file.
sort cases by sd_rating.
*3. Delete straightliners from data.
select if sd_rating > 0.
exe.
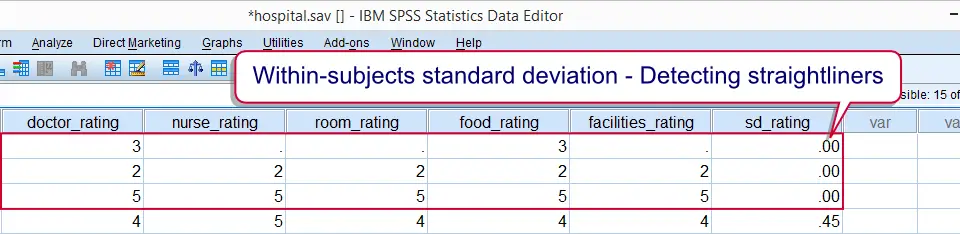 Detecting potential straightliners with SPSS SD function.
SPSS VARIANCE Function
SPSS VARIANCE function computes the within-subjects variance over a number of variables. It's simply the squared standard deviation.
compute variance_rating = variance(doctor_rating to facilities_rating).
exe.
SPSS MEDIAN Function
Finally, the median over a number of values is returned by SPSS MEDIAN function. Again, note that we refer to the within-subjects median. The syntax below demonstrates it on our rating variables.
compute median_rating = median(doctor_rating to facilities_rating).
exe.
THIS TUTORIAL HAS 16 COMMENTS:
By Ruben Geert van den Berg on June 12th, 2016
Hi Raja!
The easiest option is with AGGREGATE. I'll add a quick example below. Your test data look kinda odd, though. Did mother 2 in household 2 have a triplet as her "first" child?
Best,
Ruben
data list free/household mother child.begin data
1 1 1 1 1 2 1 1 3 1 1 4 1 1 5 1 2 1 1 2 2 1 2 3 1 1 1 2 1 2 2 1 3 2 1 4 2 2 1 2 2 1 2 2 1
end data.
aggregate outfile * mode addvariables

/break household mother

/maxchild = max(child).
compute f1 = (child = maxchild).

variable labels f1 "Filter for last child within mother within household".
filter by f1.

frequencies child.
By Raja on June 12th, 2016
Thank you so much. It works for my file. But problem is that --I have 30000 data. I can not use "Begin data---End data" function. How can I use whole 30000 data ?
By Raja on June 12th, 2016
I did it. Thank you so much again.
By Ruben Geert van den Berg on June 13th, 2016
Hi Raja!
Sorry for my late reply (I spent my weekend in the countryside - needed to chill out a couple of days) but I'm happy to hear it's been fixed. Keep up the good work!
Ruben
By habibu abdulrahman on October 6th, 2016
tank you for notifying me, your's faithfully