SPSS means “Statistical Package for the Social Sciences” and was first launched in 1968. Since SPSS was acquired by IBM in 2009, it's officially known as IBM SPSS Statistics but most users still just refer to it as “SPSS”.
SPSS - Quick Overview Main Features
SPSS is software for editing and analyzing all sorts of data. These data may come from basically any source: scientific research, a customer database, Google Analytics or even the server log files of a website. SPSS can open all file formats that are commonly used for structured data such as
- spreadsheets from MS Excel or OpenOffice;
- plain text files (.txt or .csv);
- relational (SQL) databases;
- Stata and SAS.
Let's now have a quick look at what SPSS looks and feels like.
SPSS Data View
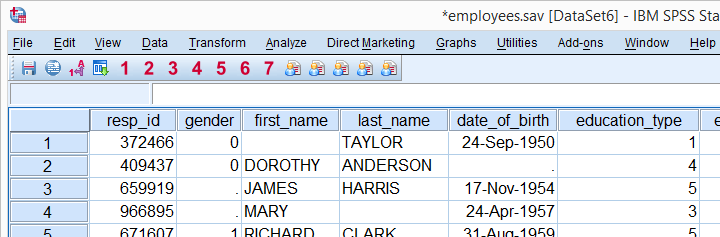
After opening data, SPSS displays them in a spreadsheet-like fashion as shown in the screenshot below from freelancers.sav.
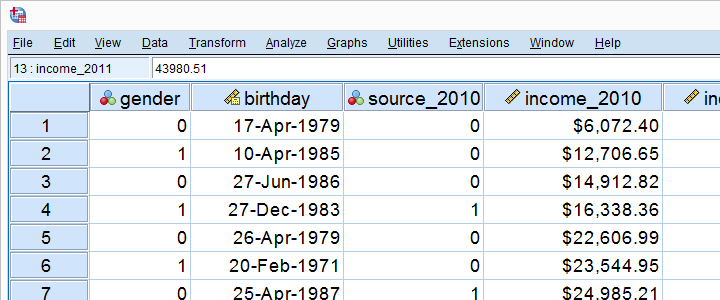
This sheet -called data view- always displays our data values. For instance, our first record seems to contain a male respondent from 1979 and so on. A more detailed explanation on the exact meaning of our variables and data values is found in a second sheet shown below.
SPSS Variable View
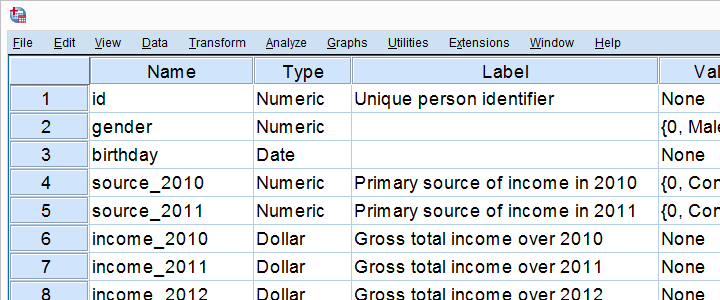
An SPSS data file always has a second sheet called variable view. It shows the metadata associated with the data. Metadata is information about the meaning of variables and data values. This is generally known as the “codebook” but in SPSS it's called the dictionary.
For non SPSS users, the look and feel of SPSS’ Data Editor window probably come closest to an Excel workbook containing two different but strongly related sheets.
Data Analysis
Right, so SPSS can open all sorts of data and display them -and their metadata- in two sheets in its Data Editor window. So how to analyze your data in SPSS? Well, one option is using SPSS’ elaborate menu options.
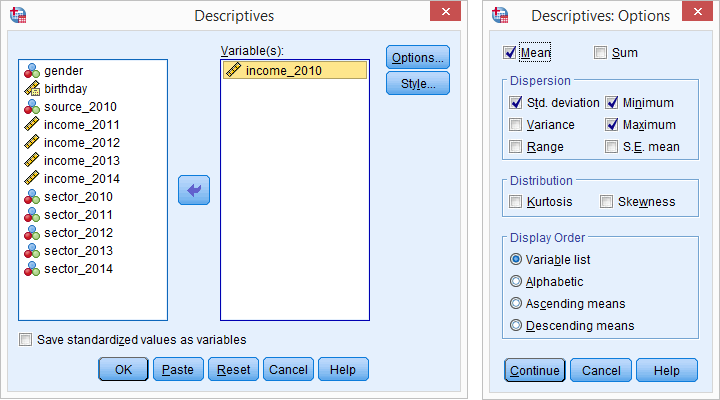
For instance, if our data contain a variable holding respondents’ incomes over 2010, we can compute the average income by navigating to as shown below.
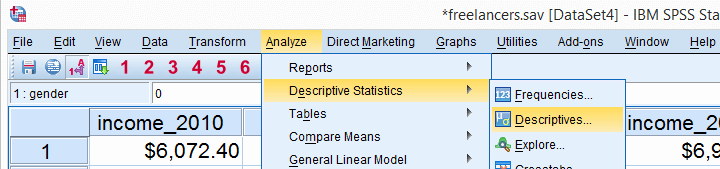
Doing so opens a dialog box in which we select one or many variables and one or several statistics we'd like to inspect.
SPSS Output Window
After clicking , a new window opens up: SPSS’ output viewer window. It holds a nice table with all statistics on all variables we chose. The screenshot below shows what it looks like.
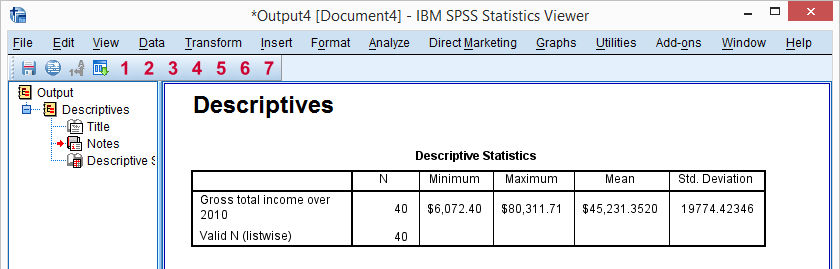
As we see, the Output Viewer window has a different layout and structure than the Data Editor window we saw earlier. Creating output in SPSS does not change our data in any way; unlike Excel, SPSS uses different windows for data and research outcomes based on those data.
For non SPSS users, the look and feel of SPSS’ Output Viewer window probably comes closest to a Powerpoint slide holding items such as blocks of text, tables and charts.
SPSS Reporting
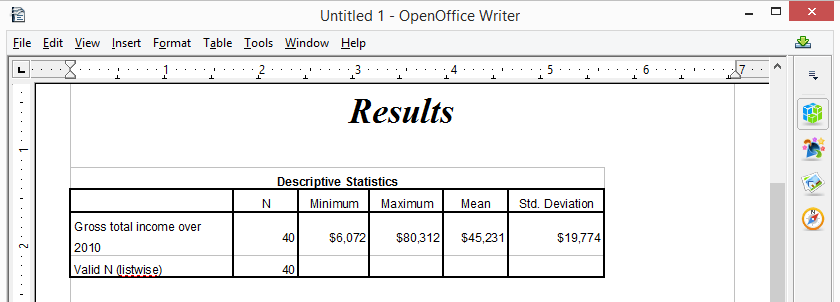
SPSS Output items, typically tables and charts, are easily copy-pasted into other programs. For instance, many SPSS users use a word processor such as MS Word, OpenOffice or GoogleDocs for reporting. Tables are usually copied in rich text format, which means they'll retain their styling such as fonts and borders. The screenshot below illustrates the result.
SPSS Syntax Editor Window
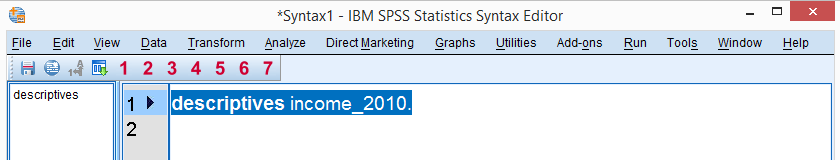
The output table we showed was created by running from SPSS’ menu. Now, SPSS has a second option for running this (or any other) command: we can open a third window, known as the syntax editor window. Here we can type and run SPSS code known as SPSS syntax. For instance, running descriptives income_2010. has the exact same result as running this command from SPSS’ menu like we did earlier.
Besides typing commands into the Syntax Editor window, most of them can also be pasted into it by clicking through SPSS’ menu options. Like so, SPSS users unfamiliar with syntax can still use it. But why use syntax if SPSS has such a nice menu?
The basic point is that syntax can be saved, corrected, rerun and shared between projects or users. Your syntax makes your SPSS work replicable. If anybody raises any doubts regarding your outcomes, you can show exactly what you did and -if needed- correct and rerun it in seconds.
For non SPSS users, the look and feel of SPSS’ Syntax Editor window probably come closest to Notepad: a single window basically just containing plain text.
SPSS - Overview Main Features
Now that we have a basic idea of how SPSS works, let's take a look at what it can do. Following a typical project workflow, SPSS is great for
- Opening data files, either in SPSS’ own file format or many others;
- editing data such as computing sums and means over columns or rows of data. SPSS has outstanding options for more complex operations as well.
- creating tables and charts containing frequency counts or summary statistics over (groups of) cases and variables.
- running inferential statistics such as ANOVA, regression and factor analysis.
- saving data and output in a wide variety of file formats.
We'll now take a closer look at each one of these features.
Opening Data Files
SPSS has its own data file format. Other file formats it easily deals with include MS Excel, plain text files, SQL, Stata and SAS.
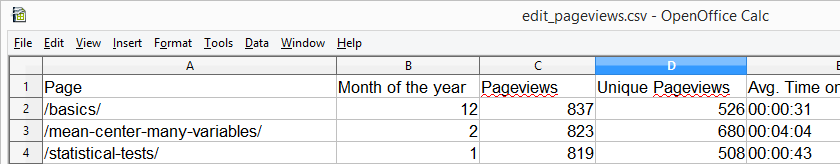 Web analytics data -often downloaded as Excel files- can easily be opened and further analyzed in SPSS
Editing Data
In real world research, raw data usually need some editing before they can be properly analyzed. Typical examples are creating means or sums as new variables, restructuring data or detecting and removing unlikely observations. SPSS performs such tasks -and more complex ones- with amazing efficiency.
For getting things done fast, SPSS contains many numeric functions, string functions, date functions and other handy routines.
Tables and Charts
All basic tables and charts can be created easily and fast in SPSS. Typical examples are demonstrated under data analysis. A real weakness of SPSS is that its charts tend to be ugly and often have a clumsy layout. A great way to overcome this problem is developing and applying SPSS chart templates. Doing so, however, requires a fair amount of effort and expertise.
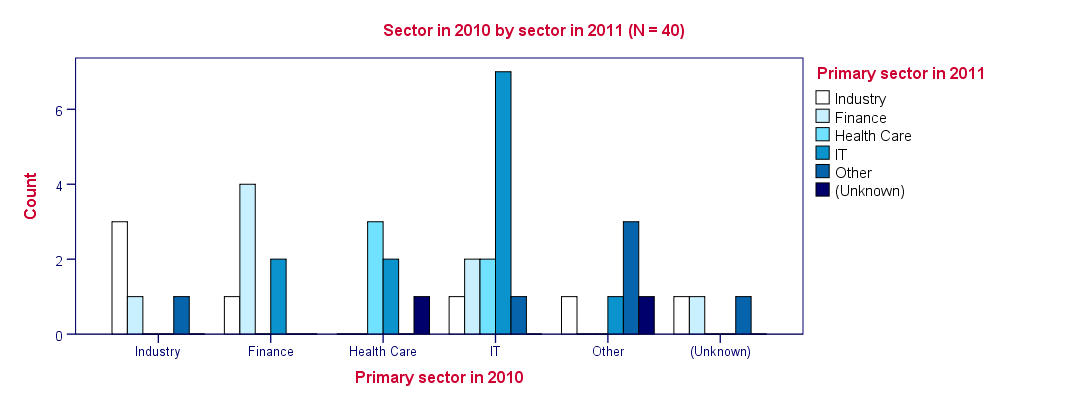 SPSS clustered bar chart with chart template applied
Inferential Statistics
SPSS contains all basic statistical tests and multivariate analyses such as
- t-tests;
- chi-square tests;
- ANOVA;
- correlations and other association measures;
- regression;
- nonparametric tests;
- factor analysis;
- cluster analysis.
Some analyses are available only after purchasing additional SPSS options on top of the main program. An overview of all commands and the options to which they belong is presented in Overview All SPSS Commands.
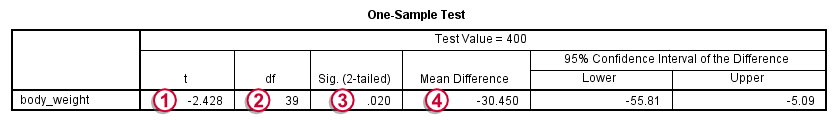 SPSS One Sample T-Test Output Example
Saving Data and Output
SPSS data can be saved as a variety of file formats, including
- MS Excel;
- plain text (.txt or .csv);
- Stata;
- SAS.
The options for output are even more elaborate: charts are often copy-pasted as images in .png format. For tables, rich text format is often used because it retains the tables’ layout, fonts and borders.
Besides copy-pasting individual output items, all output items can be exported in one go to .pdf, HTML, MS Word and many other file formats. A terrific strategy for writing a report is creating an SPSS output file with nicely styled tables and chart. Then export the entire document to Word and insert explanatory text and titles between the output items.
Right, I hope that gives at least a basic idea of what SPSS is and what it does. Let's now explore SPSS in some more detail, starting off with the Data Editor window. We'll present many more examples in the next couple of tutorials as well.
Thanks for reading!
THIS TUTORIAL HAS 483 COMMENTS:
By Siddiqui, Abdul on January 19th, 2018
good educatory materials
By grace on January 26th, 2018
Am understanding. The language used is easy to read and understand. So helpful!
By Ruben Geert van den Berg on January 26th, 2018
Happy to hear you like it Grace!
Keep up the good work!
Ruben
By Ketema Tefera on January 29th, 2018
I need more knowledge about SPSS
By garba isa hassan on February 13th, 2018
Your comment*I need more of this tutorial to master your good package for my personal development.