A p-value is the probability of finding a sample outcome
or a more extreme one given some null hypothesis.
P-values are often referred to as “significance levels” and are denoted as p in research papers.
A small p-value basically means that your data are unlikely under some null hypothesis. A somewhat arbitrary convention is to reject the null hypothesis if p < .05.
Example 1 - 10 Coin Flips
I've a coin and my null hypothesis is that it's balanced - which means it has a 0.5 chance of landing heads up. I flip my coin 10 times, which may result in 0 through 10 heads landing up. The probabilities for these outcomes -assuming my coin is really balanced- are shown below.Technically, this is a binomial distribution. The formula for computing these probabilities is based on mathematics and the (very general) assumption of independent and identically distributed variables
.
Keep in mind that probabilities are relative frequencies. So the 0.24 probability of finding 5 heads means that if I'd draw a 1,000 samples of 10 coin flips, some 24% of those samples should result in 5 heads up.
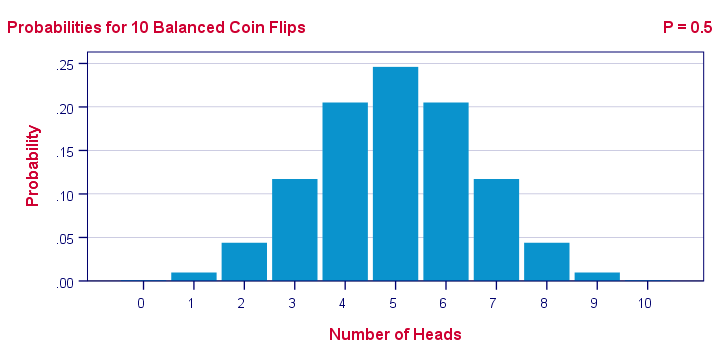
Now, 9 of my 10 coin flips actually land heads up. The previous figure says that the probability of finding 9 or more heads in a sample of 10 coin flips, p = 0.01. If my coin is really balanced, the probability is only 1 in 100 of finding what I just found.
So, based on my sample of N = 10 coin flips, I reject the null hypothesis: I no longer believe that my coin was balanced after all.
Example 2 - T-Test
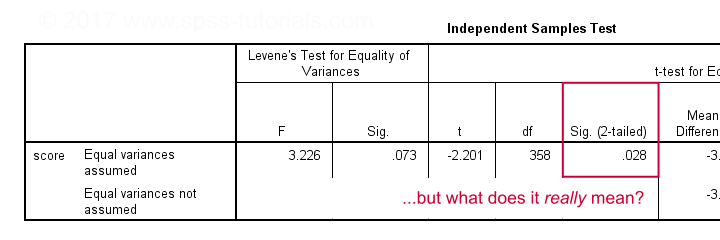
A sample of 360 people took a grammar test. We'd like to know if male respondents score differently than female respondents. Our null hypothesis is that on average, male respondents score the same number of points as female respondents. The table below summarizes the means and standard deviations for this sample.
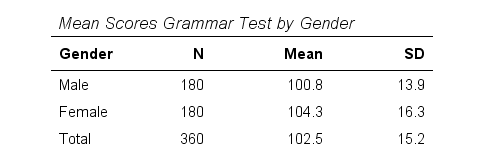
Note that females scored 3.5 points higher than males in this sample. However, samples typically differ somewhat from populations. The question is: if the mean scores for all males and all females are equal, then what's the probability of finding this mean difference or a more extreme one in a sample of N = 360? This question is answered by running an independent samples t-test.
Test Statistic - T
So what sample mean differences can we reasonably expect? Well, this depends on
- the standard deviations and
- the sample sizes we have.
We therefore standardize our mean difference of 3.5 points, resulting in t = -2.2 So this t-value -our test statistic- is simply the sample mean difference corrected for sample sizes and standard deviations. Interestingly, we know the sampling distribution -and hence the probability- for t.
1-Tailed Statistical Significance
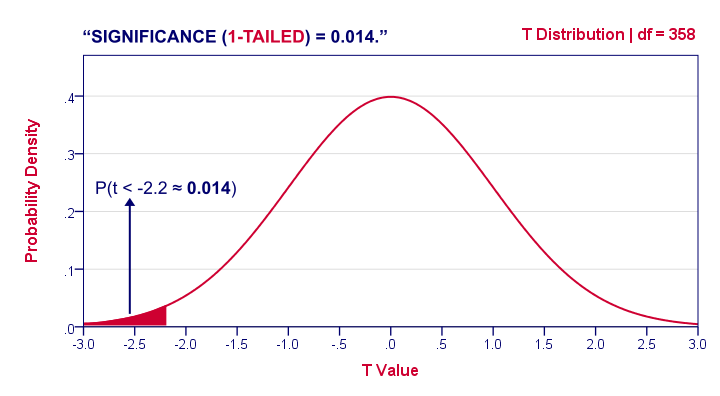
1-tailed statistical significance is the probability of finding a given deviation from the null hypothesis -or a larger one- in a sample.
In our example, p (1-tailed) ≈ 0.014. The probability of finding t ≤ -2.2 -corresponding to our mean difference of 3.5 points- is 1.4%. If the population means are really equal and we'd draw 1,000 samples, we'd expect only 14 samples to come up with a mean difference of 3.5 points or larger.
In short, this sample outcome is very unlikely if the population mean difference is zero. We therefore reject the null hypothesis. Conclusion: men and women probably don't score equally on our test.
Some scientists will report precisely these results. However, a flaw here is that our reasoning suggests that we'd retain our null hypothesis if t is large rather than small. A large t-value ends up in the right tail of our distribution. However, our p-value only takes into account the left tail in which our (small) t-value of -2.2 ended up. If we take into account both possibilities, we should report p = 0.028, the 2-tailed significance.
2-Tailed Statistical Significance

2-tailed statistical significance is the probability of finding a given absolute deviation from the null hypothesis -or a larger one- in a sample.
For a t test, very small as well as very large t-values are unlikely under H0. Therefore, we shouldn't ignore the right tail of the distribution like we do when reporting a 1-tailed p-value. It suggests that we wouldn't reject the null hypothesis if t had been 2.2 instead of -2.2. However, both t-values are equally unlikely under H0.
A convention is to compute p for t = -2.2 and the opposite effect: t = 2.2. Adding them results in our 2-tailed p-value: p (2-tailed) = 0.028 in our example. Because the distribution is symmetrical around 0, these 2 p-values are equal. So we may just as well double our 1-tailed p-value.
1-Tailed or 2-Tailed Significance?
So should you report the 1-tailed or 2-tailed significance? First off, many statistical tests -such as ANOVA and chi-square tests- only result in a 1-tailed p-value so that's what you'll report. However, the question does apply to t-tests, z-tests and some others.
There's no full consensus among data analysts which approach is better. I personally always report 2-tailed p-values whenever available. A major reason is that when some test only yields a 1-tailed p-value, this often includes effects in different directions.
“What on earth is he tryi...?” That needs some explanation, right?
T-Test or ANOVA?
We compared young to middle aged people on a grammar test using a t-test. Let's say young people did better. This resulted in a 1-tailed significance of 0.096. This p-value does not include the opposite effect of the same magnitude: middle aged people doing better by the same number of points. The figure below illustrates these scenarios.

We then compared young, middle aged and old people using ANOVA. Young people performed best, old people performed worst and middle aged people are exactly in between. This resulted in a 1-tailed significance of 0.035. Now this p-value does include the opposite effect of the same magnitude.
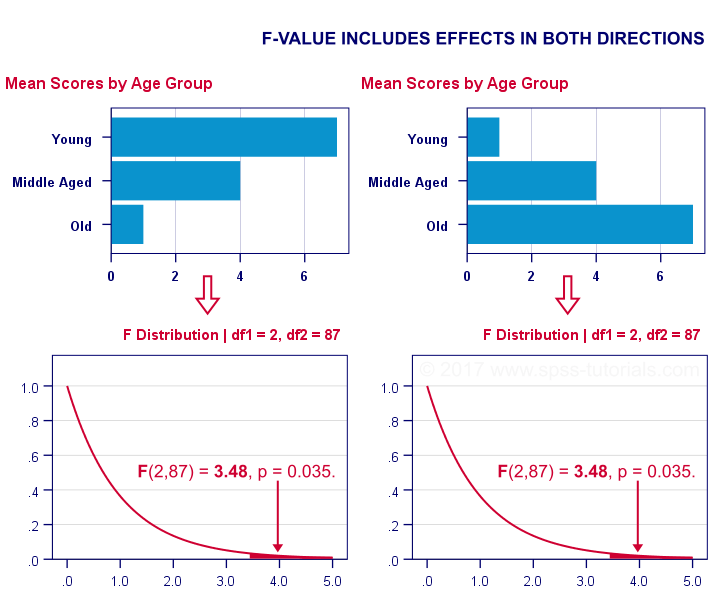
Now, if p for ANOVA always includes effects in different directions, then why would you not include these when reporting a t-test? In fact, the independent samples t-test is technically a special case of ANOVA: if you run ANOVA on 2 groups, the resulting p-value will be identical to the 2-tailed significance from a t-test on the same data. The same principle applies to the z-test versus the chi-square test.
The “Alternative Hypothesis”
Reporting 1-tailed significance is sometimes defended by claiming that the researcher is expecting an effect in a given direction. However,
I cannot verify that.
Perhaps such “alternative hypotheses” were only made up in order to render results more statistically significant.
Second, expectations don't rule out possibilities. If somebody is absolutely sure that some effect will have some direction, then why use a statistical test in the first place?
Statistical Versus Practical Significance
So what does “statistical significance” really tell us? Well, it basically says that some effect is very probably not zero in some population. So is that what we really want to know? That a mean difference, correlation or other effect is “not zero”?
No. Of course not.
We really want to know how large some mean difference, correlation or other effect is. However, that's not what statistical significance tells us.
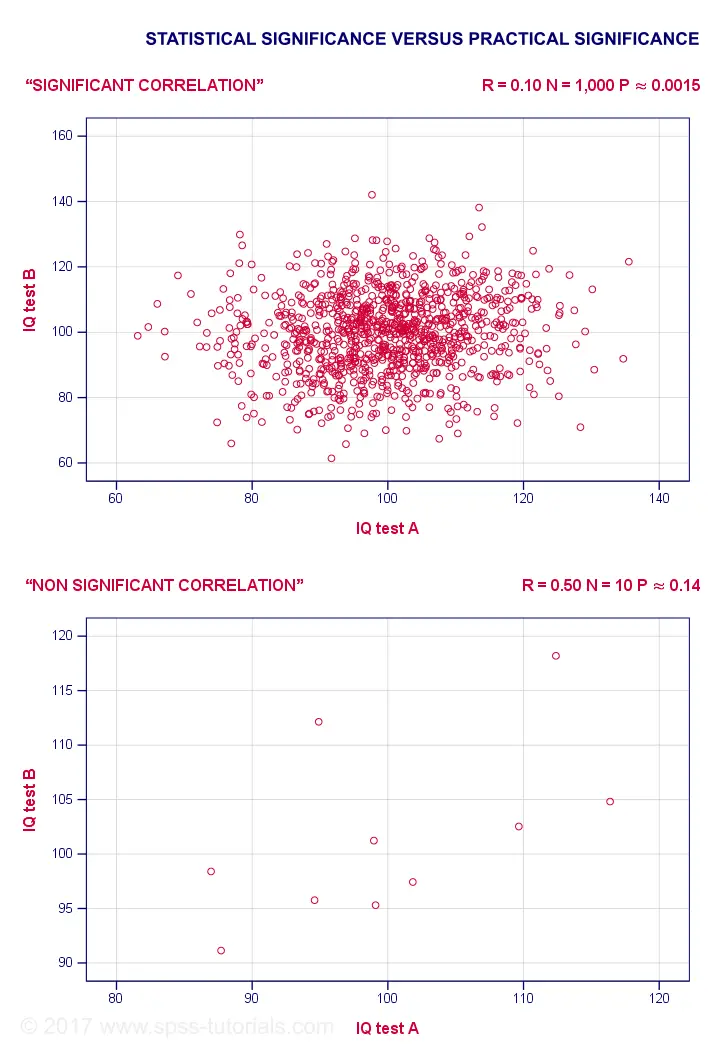
For example, a correlation of 0.1 in a sample of N = 1,000 has p ≈ 0.0015. This is highly statistically significant: the population correlation is very probably not 0.000... However, a 0.1 correlation is not distinguishable from 0 in a scatterplot. So it's probably not practically significant.
Reversely, a 0.5 correlation with N = 10 has p ≈ 0.14 and hence is not statistically significant. Nevertheless, a scatterplot shows a strong relation between our variables. However, since our sample size is very small, this strong relation may very well be limited to our small sample: it has a 14% chance of occurring if our population correlation is really zero.
The basic problem here is that
any effect is statistically significant if the
sample size is large enough.
And therefore, results must have both statistical and practical significance in order to carry any importance. Confidence intervals nicely combine these two pieces of information and can thus be argued to be more useful than just statistical significance.
Thanks for reading!
THIS TUTORIAL HAS 14 COMMENTS:
By KEFALE on May 26th, 2021
God may bless you
By John Xie on January 12th, 2022
A p-value, or a confidence interval maybe referred to for claiming the so-called "statistical significance". However, both are continuous variables. Any attempt to dichotomize or categorize a continuous variable will be logically not defensible. Therefore, forget about "Statistically significance" entirely!
By John Ametefe on October 15th, 2022
GREAT
By Lazarus Nweke on April 25th, 2023
It is very obvious that Test of significance is a bedrock of research works.