Quick Definition
Z-scores are scores that have mean = 0
and standard deviation = 1.
Z-scores are also known as standardized scores because they are scores that have been given a common standard. This standard is a mean of zero and a standard deviation of 1.
Contrary to what many people believe, z-scores are not necessarily normally distributed.
Z-Scores - Example
A group of 100 people took some IQ test. My score was 5. So is that good or bad? At this point, there's no way of telling because we don't know what people typically score on this test. However, if my score of 5 corresponds to a z-score of 0.91, you'll know it was pretty good: it's roughly a standard deviation higher than the average (which is always zero for z-scores).
What we see here is that standardizing scores facilitates the interpretation of a single test score. Let's see how that works.
Scores - Histogram

A quick peek at some of our 100 scores on our first IQ test shows a minimum of 1 and a maximum of 6. However, we'll gain much more insight into these scores by inspecting their histogram as shown below.
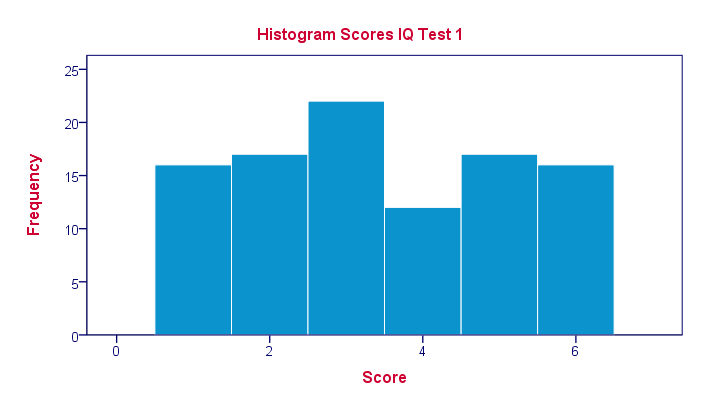
The histogram confirms that scores range from 1 through 6 and each of these scores occurs about equally frequently. This pattern is known as a uniform distribution and we typically see this when we roll a die a lot of times: numbers 1 through 6 are equally likely to come up. Note that these scores are clearly not normally distributed.
Z-Scores - Standardization
We suggested earlier on that giving scores a common standard of zero mean and unity standard deviation facilitates their interpretation. We can do just that by
- first subtracting the mean over all scores from each individual score and
- then dividing each remainder by the standard deviation over all scores.
These two steps are the same as the following formula:
$$Z_x = \frac{X_i - \overline{X}}{S_x}$$
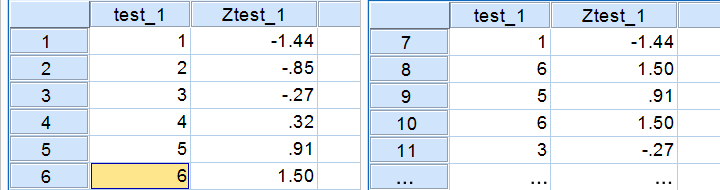
As shown by the table below, our 100 scores have a mean of 3.45 and a standard deviation of 1.70.
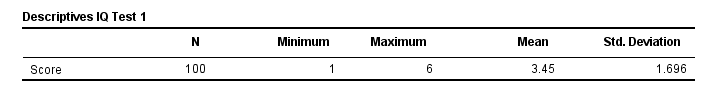 By entering these numbers into the formula, we see why a score of 5 corresponds to a z-score of 0.91:
$$Z_x = \frac{5 - 3.45}{1.70} = 0.91$$
In a similar vein, the screenshot below shows the z-scores for all distinct values of our first IQ test added to the data.
Z-Scores - Histogram
In practice, we obviously have some software compute z-scores for us. We did so and ran a histogram on our z-scores, which is shown below.
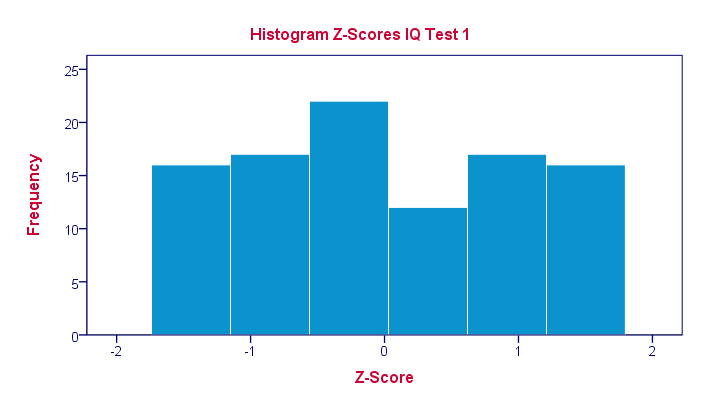 If you look closely, you'll notice that the z-scores indeed have a mean of zero and a standard deviation of 1. Other than that, however, z-scores follow the exact same distribution as original scores. That is, standardizing scores doesn't make their distribution more “normal” in any way.
What's a Linear Transformation?
Z-scores are linearly transformed scores. What we mean by this, is that if we run a scatterplot of scores versus z-scores, all dots will be exactly on a straight line (hence, “linear”). The scatterplot below illustrates this. It contains 100 points but many end up right on top of each other.
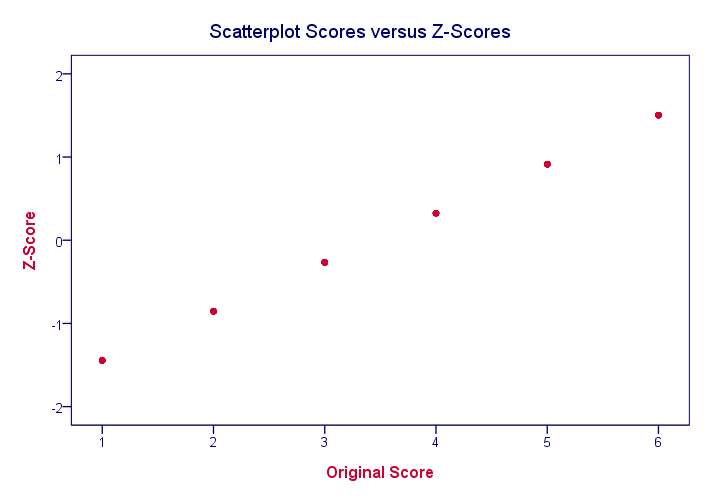
In a similar vein, if we had plotted scores versus squared scores, our line would have been curved; in contrast to standardizing, taking squares is a non linear transformation.
Z-Scores and the Normal Distribution
We saw earlier that standardizing scores doesn't change the shape of their distribution in any way; distribution don't become any more or less “normal”. So why do people relate z-scores to normal distributions?
The reason may be that many variables actually do follow normal distributions. Due to the central limit theorem, this holds especially for test statistics. If a normally distributed variable is standardized, it will follow a standard normal distribution.
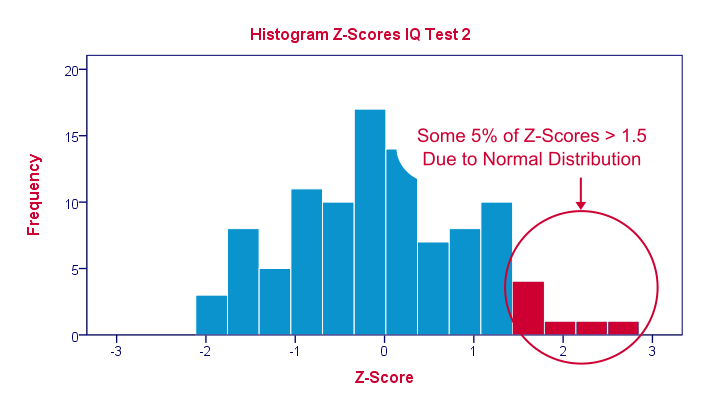
This is a common procedure in statistics because values that (roughly) follow a standard normal distribution are easily interpretable. For instance, it's well known that some 2.5% of values are larger than two and some 68% of values are between -1 and 1.
The histogram below illustrates this: if a variable is roughly normally distributed, z-scores will roughly follow a standard normal distribution. For z-scores, it always holds (by definition) that a score of 1.5 means “1.5 standard deviations higher than average”. However, if a variable also follows a standard normal distribution, then we also know that 1.5 roughly corresponds to the 95th percentile.
Z-Scores in SPSS
SPSS users can easily add z-scores to their data by using a DESCRIPTIVES command as in
descriptives test_1 test_2/save.
in which “save” means “save z-scores as new variables in my data”. For more details, see z-scores in SPSS.
THIS TUTORIAL HAS 8 COMMENTS:
By Pedro Balestrini on November 11th, 2016
Hello! This is my question. If I need to compare two variables that have been measured through different metric scale to see which one is the most frequent over the same sample, do I have to standardize all scores to z-scores and then compare the median of both distributions?
By Ruben Geert van den Berg on November 12th, 2016
Hi Pedro! What are your variables and what are their "metric scales"?
If their scales are truly metric and they measure the same thing, then there should be a standard formula for converting one scale into the other. For example, Euros to Dollars, degrees Celcius to Farenheit, stones to kilograms or inches to meters are all pretty straightforward.
However, IQ test A to IQ test B may not be so straightforward because these aren't really metric: there's no clearly defined unit of measurement here. Comparing such variables may be tricky at best because it's hard to say if you're really comparing people's IQ or just a characteristic of the test being used instead -or a bit of both.
By Pedro Balestrini on November 12th, 2016
Hello, Ruben. I really appreciate your answer. I think I made a mistake when I used the word “metric”. The variables my students usually analyse and need to compare are generated through social surveys. I guess they are not truly metric but conventionally constructed through the aggregation of scores from different questionnaire ítems. “ordinal” would probably best describe them. That´s why a standard convertion wouldn´t be feasible. Should they, then, transform the scores they get into z-scores?
The level of government policy approval revealed by a simple of 60 participants of diffent socio-economic statuses is a good example of the type of data sets my students obtain. In order to establish appropriate group differences a mechanisms of standardization must be used. Am I right?
The comparison of the effectiveness of different psicological treatments -measures through different tests- can also exemplify the challenges they usually face. Have I made myself clear? (I must confess my statistical knowledge is rather por. I´m a philosophy teacher…)
Thank you very much for your reply.
By Ruben Geert van den Berg on November 12th, 2016
Hi Pedro!
You can use z-scores to compare an individual to all other individuals on the same variable.
For comparing one variable (column of data values) to another, they need to have the same scale. Strictly, this must be a metric scale with clearly defined measurement units.
Less strictly, if you used identical Likert scales (such as 5 = very good, 4 = good and so on), many applied researchers will implicitly make the assumption of equal intervals and compare them anyway. It's often argued that means over such variables with similar answer categories have similar "scales" and are therefore intercomparable too. This doesn't always hold for sums because these depend on the number of variables used for them.
However, you can't seriously compare two variables that have different answer categories. Even if they measure the exact same thing, the precise answer categories have been shown to have a serious and unpredictable influence on the research outcomes. So differences between variables may or may not reflect differences in whatever they are attempting to measure.
There's no mathematical formula that'll solve this problem and this is a real problem for changing questionnaires during longitudinal market research: the old data are no longer comparable to the new data.
Hope this clarifies things a bit more!
By Md. Abu Talab on February 5th, 2018
z value in spss