SPSS FACTOR Computes Wrong Covariances
- Summary
- Wrong Covariances from FACTOR
- Correct Covariances from CORRELATIONS
- Correct Covariances from REGRESSION
Summary
When using pairwise exclusion of missing values, SPSS FACTOR computes wrong covariances. For correct covariances, use
- CORRELATIONS (menu or syntax) or
- REGRESSION (syntax only).
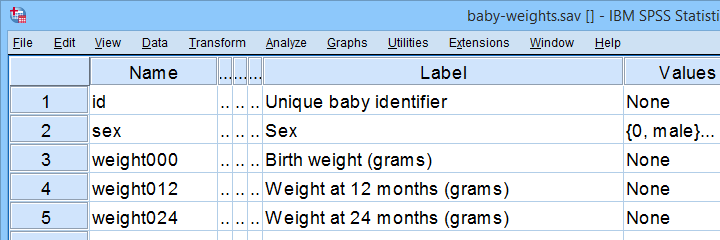
This tutorial presents a quick comparison of these 3 methods. We'll use baby-weights.sav -partly shown below- for all examples.
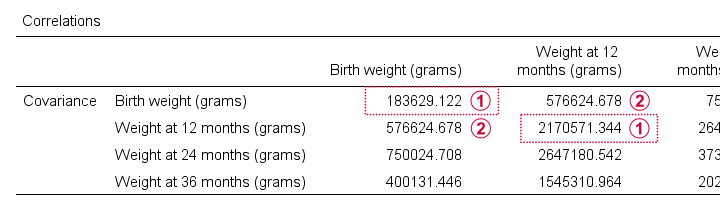
Wrong Covariances from FACTOR
Right. So let's compute the covariance matrix for weight000 through weight036 by using FACTOR. The SPSS syntax below does so using pairwise exclusion of missing values.
factor
/variables weight000 to weight036
/missing pairwise
/print correlation covariance.
Result
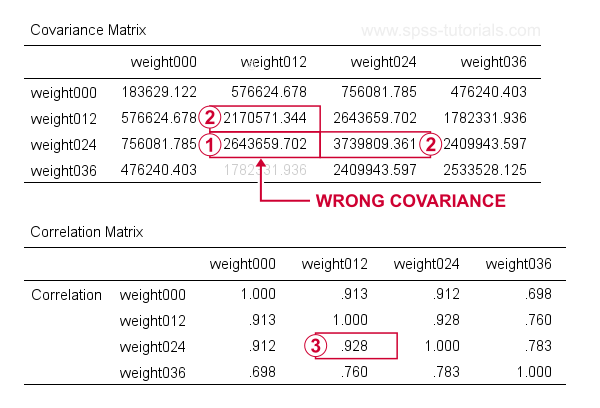
At first, these results look perfect. Now, let's recompute  the covariance between weight012 and weigh024 from
  the variances and
  the correlation for these variables by using
$$S_{xy} = r_{xy} \cdot s_x \cdot s_y$$
where
- \(S_{xy}\) denotes the (sample) covariance between variables \(X\) and \(Y\);
- \(r_{xy}\) denotes the (Pearson) correlation between \(X\) and \(Y\);
- \(s_x\) and \(s_y\) denote the (sample) standard deviations of \(X\) and \(Y\).
This gives
$$S_{xy} = 0.928 \cdot \sqrt{2170571} \cdot \sqrt{3739809} = 2643660$$
which is indeed what SPSS reports here. So how could this possibly be wrong? Our second approach will clarify just that and come up with different -but correct- results.
Correct Covariances from CORRELATIONS
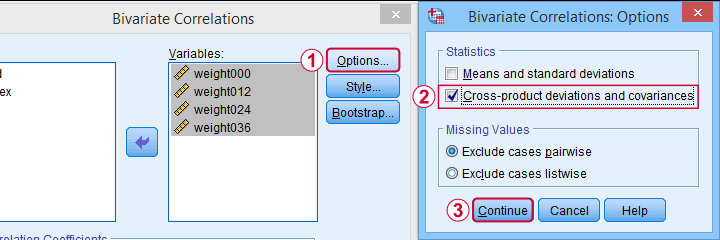
The only way to obtain covariances from SPSS’ menu is by navigating to
![]()
![]() as shown below.
as shown below.
This results in the syntax below. Let's run it.
CORRELATIONS
/VARIABLES=weight000 weight012 weight024 weight036
/PRINT=TWOTAIL NOSIG FULL
/STATISTICS XPROD
/MISSING=PAIRWISE.
Result
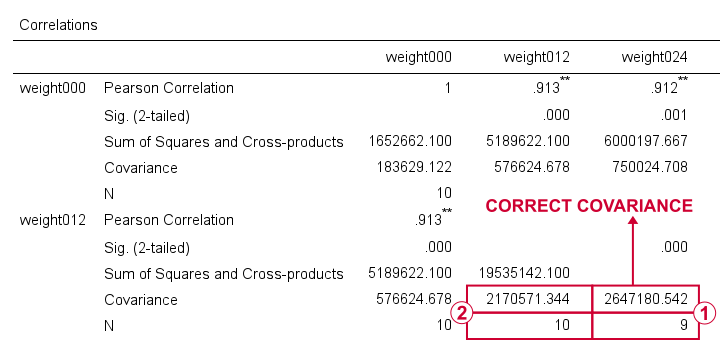
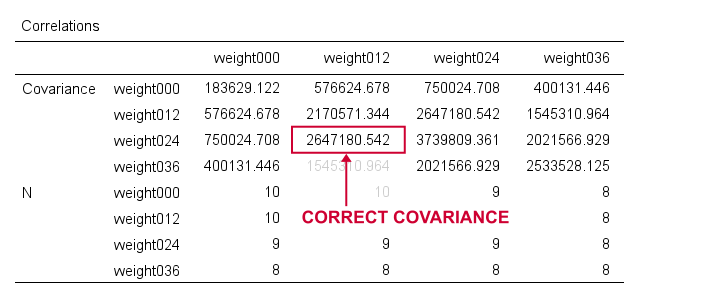
For weight012 and weight024, SPSS reports \(S_{xy}\) = 2647181. Note that this is based on a subsample of N = 9 cases due to pairwise exclusion of missing values.
The variance for weight012, however, is based on a different subsample of N = 10...
...and that's why the previous results were wrong. FACTOR seems to compute each covariance from a correlation and two variances that may all be based on different subsamples!
CORRELATIONS, however, correctly computes all components for a covariance on the same subsample: all cases having valid values on both variables. Alternative software such as Excel and Googlesheets also comply with this approach.
I think these results provide sufficient evidence for my claim that FACTOR may compute wrong covariances. Nevertheless, let's see what our third -and best- method for obtaining covariances comes up with...
Correct Covariances from REGRESSION
The syntax below illustrates how to obtain covariances and the sample sizes they're based on via REGRESSION.
regression
/missing pairwise
/dependent weight000
/method enter weight012 to weight036
/descriptives n cov.
Result
Although the multiple regression results aren't helpful, the previous syntax does result in a nice and clean covariance matrix as shown below.
First off, note that REGRESSION comes up with the same (correct) covariances as CORRELATIONS. So that makes 1 against 2 -or more if we take Excel and/or Googlesheets into account.
Second, note that REGRESSION results in a convenient table layout that's sorted by statistic rather than by variable. This usually comes in handy for further processing such as
- computing Cronbach’s alpha or
- some kind of factor analysis.
So that's basically it. Let me know what you think by throwing in a comment below. We always appreciate some feedback. Also if you think our tutorials totally suck.
Thanks for reading!
Covariance – Quick Introduction
- Covariance - What is It?
- Covariance or Correlation?
- Sample Covariance Formula
- Covariance Calculation Example
- Software for Computing Covariances
Covariance - What is It?
A covariance is basically an unstandardized correlation. That is: a covariance is a number that indicates to what extent 2 variables are linearly related. In contrast to a (Pearson) correlation, however, a covariance depends on the scales of both variables involved as expressed by their standard deviations.
The figure below visualizes some correlations and covariances as scatterplots.
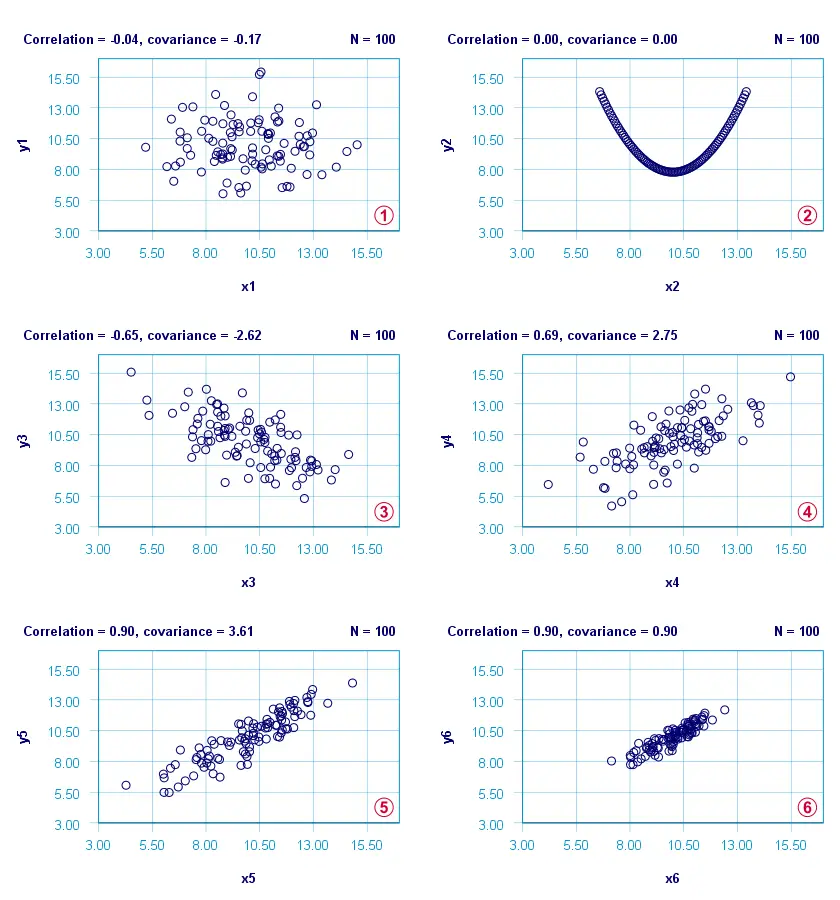
x1 and y1 are basically unrelated. The covariance and correlation are both close to zero;
x2 and y2 are strongly related but not linearly at all. The covariance and correlation are zero.
x3 and y3 are negatively related. The covariance and correlation are both negative;
 x4 and y4 are positively related. The covariance and correlation are both positive;
 x5 and y5 are strongly positively related. Because they have the same standard deviations as x4 and y4, the correlation and covariance both increase;
 x6 and y6 are identical to x5 and y5 except that their standard deviations are 1.0 instead of 2.0. This shrinks the covariance with a factor 4.0 but does not affect the correlation.
Comparing plots and emphasizes that covariances are scale dependent whereas correlations aren't. This may make you wonder
why should I ever compute a covariance
instead of a correlation?
Covariance or Correlation?
First off, the precise relation between a covariance and correlation is given by
$$S_{xy} = r_{xy} \cdot s_x \cdot s_y$$
where
- \(S_{xy}\) denotes the (sample) covariance between variables \(X\) and \(Y\);
- \(r_{xy}\) denotes the (Pearson) correlation between \(X\) and \(Y\);
- \(s_x\) and \(s_y\) denote the (sample) standard deviations of \(X\) and \(Y\).
This formula shows that a covariance can be seen as a correlation that's “weighted” by the product of the standard deviations of the 2 variables involved: everything else equal, larger standard deviations result in larger covariances.
This feature may be desirable for comparing associations among variable pairs. This only makes sense if all variables are measured on identical scales such as dollars, seconds or kilos. Some analyses that require covariances are the following:
1. Cronbach’s alpha is usually computed on covariances instead of correlations. This is because scale scores are computed as sums or means over unstandardized variables. Therefore, variables with larger SD's have more impact on scale scores. This is why associations among such variables also have more weight in the computation of Cronbach's alpha.
2. In factor analysis, a covariance matrix is sometimes analyzed instead of a correlation matrix. If so, associations among variables have more impact on the factor solution insofar as these variables have larger SD's.
3. Some analyses need to meet the assumption of equal covariance matrices over subpopulations. An example is MANOVA, in which the Box test -basically a multivariate expansion of Levene's test- is often used for testing this assumption.
4. Somewhat surprisingly, ANCOVA -meaning analysis of covariance- does not involve computing covariances.
So those are some analyses that involve covariances. So how are these computed? Well, which formula to use depends on which type of data you're analyzing.
Sample Covariance Formula
If your data contain a sample from a much larger population (usually the case), the sample covariance is computed as
$$S_{xy} = \frac{\sum\limits_{i = 1}^N(X_i - \overline{X})(Y_i - \overline{Y})}{N - 1}$$
where
- \(S_{xy}\) denotes the (sample) covariance between variables \(X\) and \(Y\);
- \(\overline{X}\) and \(\overline{Y}\) denote the sample means for \(X\) and \(Y\);
- \(N\) denotes the total sample size.
Let's now get a grip on this formula by using it in a calculation example.
Covariance Calculation Example
The table below contains the weights in grams of 10 babies at birth (X) and at age 12 months (Y). What's the covariance between X and Y?
| ID | 1 | 2 | 3 | 4 | 5 | 6 | 7 | 8 | 9 | 10 |
|---|---|---|---|---|---|---|---|---|---|---|
| X | 3777 | 3279 | 3760 | 3579 | 4138 | 3067 | 3438 | 4059 | 4493 | 3517 |
| Y | 8695 | 7844 | 9532 | 8807 | 9537 | 7073 | 8873 | 11465 | 11837 | 8604 |
First off,
- the sample size is \(N\) = 10 and the means are
- \(\overline{X}\) = 3711 and
- \(\overline{Y}\) = 9227.
Therefore,
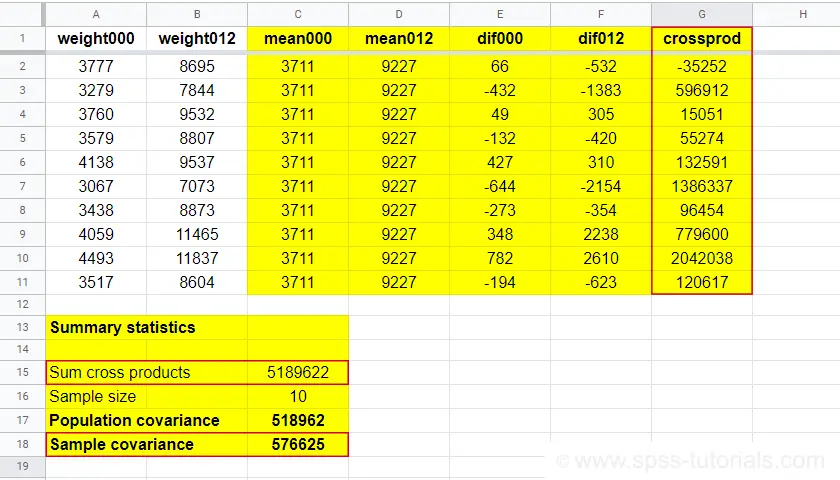
$$S_{xy} = \frac{(3777 - 3711)\cdot(8695 - 9227)\;+\;...\;+\;(3517 - 3711)\cdot(8604 - 9227)}{10 - 1}$$
$$S_{xy} = \frac{66 \cdot -532\;+\;...\;+\;-194 \cdot -623}{10 - 1}$$
$$S_{xy} = \frac{5189622}{10 - 1} = 576625$$
You can look up the entire calculation in this Googlesheet, partly shown below.
Population Covariance Formula
If your data hold the entire population you'd like to study, you can compute the covariance as
$$\sigma_{xy} = \frac{\sum\limits_{i = 1}^N(X_i - \mu_x)(Y_i - \mu_Y)}{N}$$
where
- \(\sigma_{xy}\) denotes the (population) covariance between variables \(X\) and \(Y\);
- \(\mu_x\) and \(\mu_y\) denote the population means for \(X\) and \(Y\);
- \(N\) denotes the population size.
Software for Computing Covariances
Both sample and population covariances are easily computed in Googlesheets and Excel. This Googlesheet, partly shown below, contains a couple of examples.
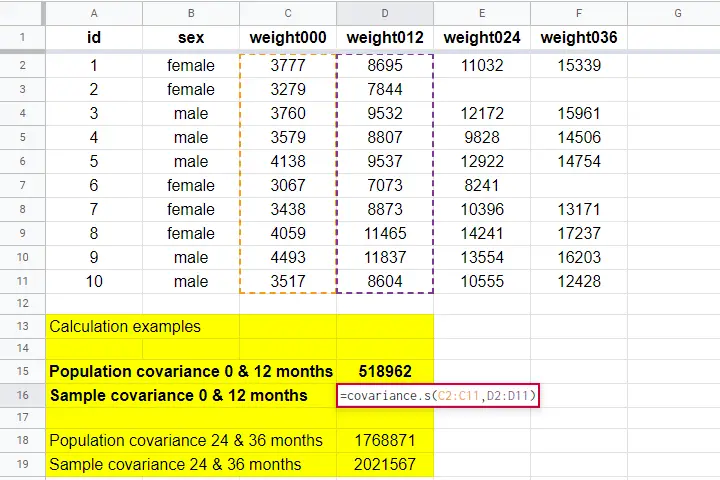
A full covariance matrix for several variables is easily obtained from SPSS. However, “covariance” in SPSS always refers to the sample covariance because
the population covariance is completely absent from SPSS.
Pretty poor for a “statistical package”. But anyway: the only menu based option for this is
![]()
![]() as illustrated below.
as illustrated below.
A much better option, however, is using SPSS syntax like we did in Cronbach’s Alpha in SPSS. This is faster and results in a much nicer table layout as shown below.
Two quick notes are in place here:
Just like a correlation matrix, a covariance matrix is symmetrical: the covariance between X and Y is obviously equal to that between Y and X.
The main diagonal contains the covariances between each variable and itself. These are simply the variances (squared standard deviations) of our variables. This last point implies that
we can compute a correlation matrix from a covariance matrix
but not reversely.
For example, the correlation between our first 2 variables is
$$r_{xy} = \frac{576625}{\sqrt{183629} \cdot \sqrt{2170571}} = 0.913$$
Right. I guess that should do regarding covariances. If you've any feedback, please throw us a comment below. Other than that:
thanks for reading!