Cohen’s kappa is a measure that indicates to what extent
2 ratings agree better than chance level.
- Cohen’s Kappa - Formulas
- Cohen’s Kappa - Interpretation
- Cohen’s Kappa in SPSS
- When (Not) to Use Cohen’s Kappa?
- Related Measures
Cohen’s Kappa - Quick Example
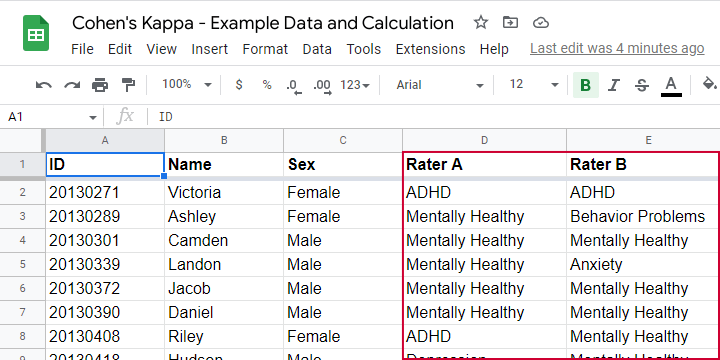
Two pediatricians observe N = 50 children. They independently diagnose each child. The data thus obtained are in this Googlesheet, partly shown below.
As we readily see, our raters agree on some children and disagree on others. So what we'd like to know is: to what extent do our raters agree on these diagnoses? An obvious approach is to compute the proportion of children on whom our raters agree. We can easily do so by creating a contingency table or “crosstab” for our raters as shown below.
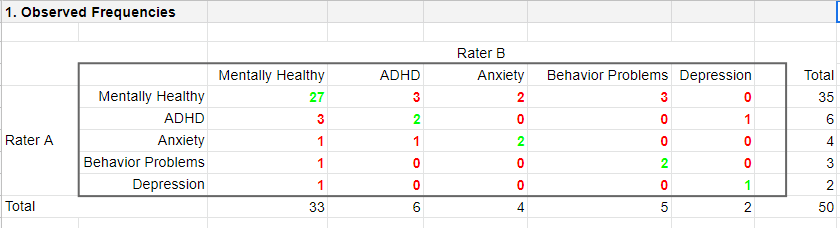
Note that the diagonal elements in green are the numbers of children on whom our raters agree. The observed agreement proportion \(P_a\) is easily calculated as
$$P_a = \frac{27 + 2 + 2 + 2 + 1}{50} = 0.68$$
This means that our raters diagnose 68% out of 50 children similarly. Now, this may seem pretty good but
what if our raters would diagnose children as (un)healthy
by simply flipping coins?
Such diagnoses would be pretty worthless, right? Nevertheless, we'd expect an agreement proportion of \(P_a\) = 0.50 in this case: our raters would agree on 50% of children just by chance.
A solution to this problem is to correct for such a chance-level agreement proportion. Cohen’s kappa does just that.
Cohen’s Kappa - Formulas
First off, how many children are diagnosed similarly? For this, we simply add up the diagonal elements (in green) in the table below.
This results in
$$\Sigma{o_{ij}} = 27 + 2 + 2 + 2 + 1 = 34$$
where \(o_{ij}\) denotes the observed frequencies on the diagonal.
Second, if our raters would not agree to any extent at all, how many similar diagnoses should we expect due to mere chance? Such expected frequencies are calculated as
$$e_{ij} = \frac{o_i\cdot o_j}{N}$$
where
- \(e_{ij}\) denotes an expected frequency;
- \(o_i\) is the corresponding marginal row frequency;
- \(o_j\) is the corresponding marginal column frequency;
- \(N\) is the total sample size.
Like so, the expected frequency for rater A = “mentally healthy” (n = 35) and rater B = “mentally healthy” (n = 33) is
$$e_{ij} = \frac{35\cdot 33}{50} = 23.1$$
The table below shows this and all other expected frequencies.
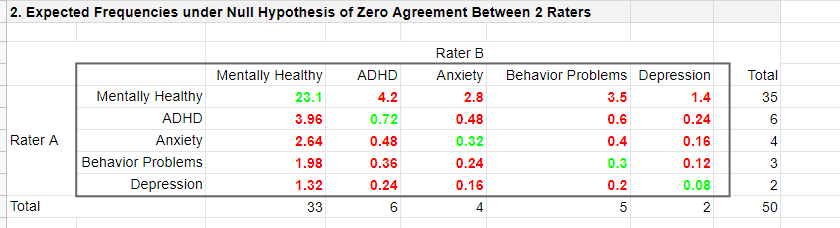
The diagonal elements in green show all expected frequencies for both raters giving similar diagnoses by mere chance. These add up to
$$\Sigma{e_{ij}} = 23.1 + 0.72 + 0.32 + 0.30 + 0.08 = 24.52$$
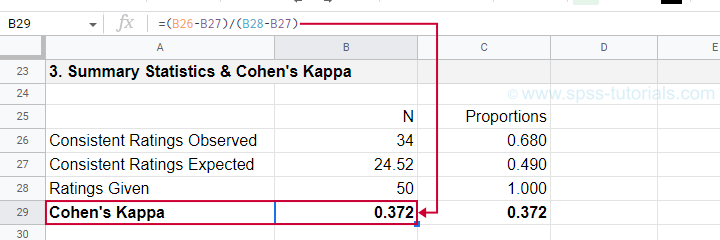
Finally, Cohen’s kappa (denoted as \(\boldsymbol \kappa\), the Greek letter kappa) is computed as3
$$\kappa = \frac{\Sigma{o_{ij}} - \Sigma{e_{ij}}}{N - \Sigma{e_{ij}}}$$
For our example, this results in
$$\kappa = \frac{34 - 24.52}{50 - 24.52} = 0.372$$
as confirmed by our Googlesheet shown below.
An alternative formula for Cohen’s kappa is
$$\kappa = \frac{P_a - P_c}{1 - P_c}$$
where
- \(P_a\) is the agreement proportion observed in our data and;
- \(P_c\) is the agreement proportion that may be expected by mere chance.
For our data, this results in
$$\kappa = \frac{0.68 - 0.49}{1 - 0.49} = 0.372$$
This formula also sheds some light on what Cohen’s kappa really means:
$$\kappa = \frac{\text{actual performance - chance performance}}{\text{perfect performance - chance performance}}$$
which comes down to
$$\kappa = \frac{\text{actual improvement over chance}}{\text{maximum possible improvement over chance}}$$
Cohen’s Kappa - Interpretation
Like we just saw, Cohen’s kappa basically indicates the extent to which observed agreement is better than chance agreement. Technically, agreement could be worse than chance too, resulting in Cohen’s kappa < 0. In short, Cohen’s kappa can run from -1.0 through 1.0 (both inclusive) where
- \(\kappa\) = -1.0 means that 2 raters perfectly disagree;
- \(\kappa\) = 0.0 means that 2 raters agree at chance level;
- \(\kappa\) = 1.0 means that 2 raters perfectly agree.
Another way to think of Cohen’s kappa is the proportion of disagreement reduction compared to chance. For our example, we expected N = 25.48 different diagnoses by chance. Since \(\kappa\) = .372, this is reduced to
$$25.48 - (25.48 \cdot 0.372) = 16$$
different (disagreeing) diagnoses by our raters.
With regard to effect size, there's no clear consensus on rules of thumb. However, Twisk (2016)4 more or less proposes that
- \(\kappa\) = 0.4 indicates a small effect;
- \(\kappa\) = 0.55 indicates a medium effect;
- \(\kappa\) = 0.7 indicates a large effect.
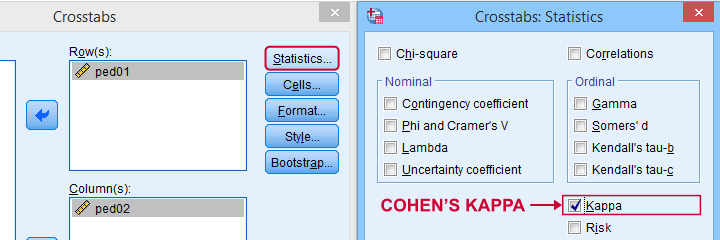
Cohen’s Kappa in SPSS
In SPSS, Cohen’s kappa is found under
![]()
![]() as shown below.
as shown below.
The output (below) confirms that  \(\kappa\) = .372 for our example.
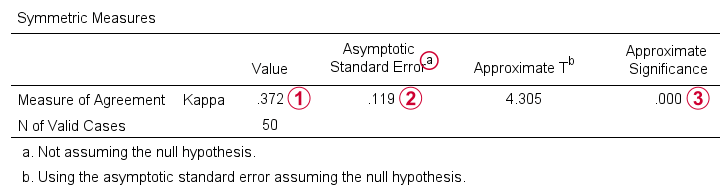
Keep in mind that the  significance level is based on the null hypothesis that \(\kappa\) = 0.0. However,
concluding that kappa is probably not zero is pretty useless
because zero doesn't come anywhere close to an acceptable value for kappa. A confidence interval would have been much more useful here but -sadly- SPSS doesn't include it.
significance level is based on the null hypothesis that \(\kappa\) = 0.0. However,
concluding that kappa is probably not zero is pretty useless
because zero doesn't come anywhere close to an acceptable value for kappa. A confidence interval would have been much more useful here but -sadly- SPSS doesn't include it.
When (Not) to Use Cohen’s Kappa?
Cohen’s kappa is mostly suitable for comparing 2 ratings if both ratings
- are nominal variables (unordered answer categories) and
- have identical answer categories.
For ordinal or quantitative variables, Cohen’s kappa is not your best option. This is because it only distinguishes between the ratings agreeing or disagreeing. So let's say we have answer categories such as
- very bad;
- somewhat bad;
- neutral;
- somewhat good;
- very good.
If 2 raters rate some item as “very bad” and “somewhat bad”, they slightly disagree. If they rate it as “very bad” and “very good”, they disagree much more strongly but Cohen’s kappa ignores this important difference: in both scenarios they simply “disagree”. A measure that does take into account how much raters disagree is weighted kappa. This is therefore a more suitable measure for ordinal variables.
Related Measures
Cohen’s kappa is an association measure for 2 nominal variables. For testing if this association is zero (both variables independent), we often use a chi-square independence test. Effect size measures for this test are
- the contingency coefficient;
- Cramér’s V;
- Cohen’s W.
These measures can basically be seen as correlations for nominal variables. So how do they differ from Cohen’s kappa? Well,
- Cohen’s kappa corrects for chance-level agreement and
- Cohen’s kappa requires both variables to have identical answer categories
whereas the other measures don't.
Second, if both ratings are ordinal, then weighted kappa is a more suitable measure than Cohen’s kappa.1 This measure takes into account (or “weights”) how much raters disagree. Weighted kappa was introduced in SPSS version 27 under
![]()
![]() as shown below.
as shown below.
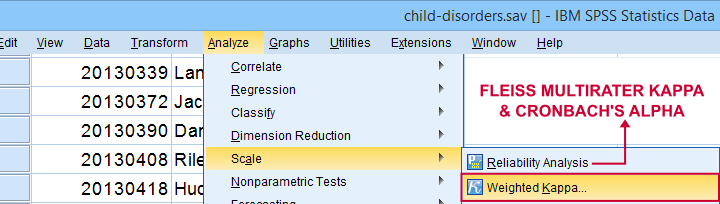
Lastly, if you have 3(+) raters instead of just two, use Fleiss-multirater-kappa. This measure is available in SPSS version 28(+) from
![]()
![]() Note that this is the same dialog as used for Cronbach’s alpha.
Note that this is the same dialog as used for Cronbach’s alpha.
References
- Van den Brink, W.P. & Koele, P. (2002). Statistiek, deel 3 [Statistics, part 3]. Amsterdam: Boom.
- Warner, R.M. (2013). Applied Statistics (2nd. Edition). Thousand Oaks, CA: SAGE.
- Howell, D.C. (2002). Statistical Methods for Psychology (5th ed.). Pacific Grove CA: Duxbury.
- Twisk, J.W.R. (2016). Inleiding in de Toegepaste Biostatistiek [Introduction to Applied Biostatistics]. Houten: Bohn Stafleu van Loghum.
- Van den Brink, W.P. & Mellenberg, G.J. (1998). Testleer en testconstructie [Test science and test construction]. Amsterdam: Boom.
- Fleiss, J.L., Levin, B. & Cho Paik, M. (2003). Statistical Methods for Rates and Proportions (3d. Edition). Hoboken, NJ: Wiley.
THIS TUTORIAL HAS 5 COMMENTS:
By Raed al Salman on December 3rd, 2022
Excellent piece of work!
Just one question: why do you present 2 different formulas for computing kappa?
By Ruben Geert van den Berg on December 4th, 2022
Hi Raed, good question!
The formula based on frequencies is technically easier to compute.
The formula based on proportions involves more computations because you need to divide each frequency by N. However, it makes clearer the exact meaning of kappa.
So that's why I decided to include both.
Hope that helps!
By YY on December 7th, 2022
Wonderful work!
My questions:
Can I use Kendall’s coefficient of concordance ( aka Kendall’s W ) for ordinal ratings?
Is it better than weighted kappa?
By Ruben Geert van den Berg on December 8th, 2022
Hi YY, great question!
Quick answer: IMHO, you can use either measure but weighted kappa is to be preferred.
Kendall’s W is basically an average Spearman correlation among 2 or more raters. (I think they're equal for exactly 2 raters.)
Now, a Spearman correlation only indicates a monotonous relation. So it is 1.0 even if rater A always rates (2 * rater B), which is zero agreement!
Kendall's W is suitable for more than 2 raters but it expresses something different (not agreement) and is not corrected for anything chance level.
Hope that helps!
SPSS tutorials
By YY on December 9th, 2022
Great thanks.
Very enlightening!