The Sobel test is a significance test for indirect effects
in mediation analysis.
- Sobel Test Example
- Sobel Test - Formulas
- Sobel Test Excel Calculator
- Sobel Test Versus Bootstrapping
- Sobel Test in PROCESS Macro
Sobel Test Example
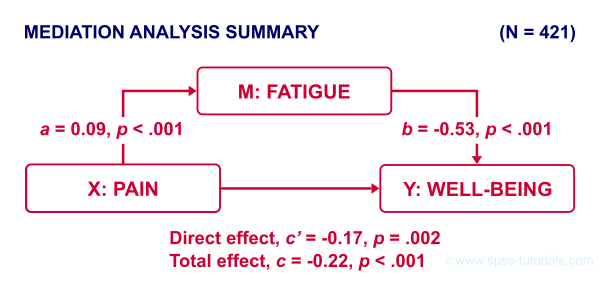
The diagram below summarizes some basic results discussed in SPSS Mediation Analysis Tutorial.

First off, note that
- path \(a\) from \(X\) onto \(M\) is statistically significant, b = 0.09, p < .001;
- path \(b\) from \(M\) onto \(Y\) is also “significant”, b = -0.53, p < .001.
Now, apart from these 2 components, what can we say about the entire indirect effect from \(X\) onto \(Y\) through \(M\)? Well, this is computed very simply as
$$\text{indirect effect} \;ab = a \cdot b$$
So for our example, that'll be
$$\text{indirect effect} \;ab = 0.09 \cdot -0.53 = -0.049$$
Note that this makes perfect sense. By analogy, if wage \(a\) is $30 per hour and tax \(b\) is $0.20 per dollar, then I'll pay $30 · $0.20 = $6.00 tax per hour.
Now, assuming our data are a random sample, we probably also want to know
- what's the p-value for the entire indirect effect \(ab\)?
- what's a confidence interval (CI) for \(ab\)?
One approach to both questions is the Sobel test. So how does it work?
Sobel Test - Formulas
First off, the Sobel test assumes that the sampling distribution for \(ab\) is a normal distribution with
$$se_{ab} = \sqrt{a^2se^2_b + b^2se^2_a + se^2_a se^2_b}$$
where
- \(se_{ab}\) denotes the standard error of \(ab\);
- \(a\) denotes path \(a\) (technically, a b-coefficient);
- \(se_a\) denotes the standard error of \(a\).
For our example, that'll be
$$se_{ab} = \sqrt{0.09^2 \cdot -0.14^2 + 0.53^2 \cdot 0.02^2 + 0.02^2 \cdot 0.14^2} = 0.016$$
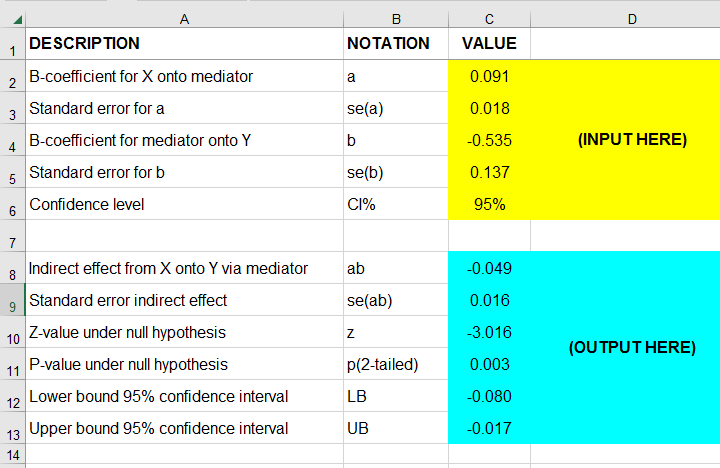
For the actual calculations, I suggest you try our Sobel Test Calculator.xlsx, partly shown below.

So first our p-value: a likely null hypothesis is that \(\mu_{ab} = 0\) and therefore
$$Z_{ab} = \frac{ab - 0}{se_{ab}}$$
is assumed to follow the standard normal distribution.
For our example, that'll be
$$Z_{ab} = \frac{-0.049}{0.016} = 3.016$$
which results in p(2-tailed) = .003: our indirect effect is highly “significant”.
Second, our confidence interval: the alternative hypothesis is that \(\mu_{ab} = ab\) and therefore,
$$CI_{ab} = ab \pm z_{({1-^{\alpha}/_2})} \cdot se_{ab}$$
For our example, the 95% CI for \(ab\) would be roughly
$$CI_{ab} = -0.049 \pm 1.96 \cdot 0.016 = [-0.080, -0.017]$$
Sobel Test Excel Calculator
For quickly running one or many Sobel tests in applied research, I created Sobel Test Calculator.xlsx (partly shown below).

I prefer this over online calculators because
- I can easily copy-paste output from SPSS into this sheet;
- doing so is super precise because all decimal places are preserved (even though they're not shown);
- I can save this file with all input, output and formulas within my project archives so everything is accountable and replicable;
- for multiple Sobel tests, I can quickly and easily add some columns and duplicate parts of the input.
Sobel Test Versus Bootstrapping
For mediation analysis, bootstrapping is often preferred over the Sobel test because
- it's believed that \(ab\) is generally not exactly normally distributed, especially in smaller samples;
- bootstrapping is thought to have more power (that is, result in smaller CI's).
As a quick test, we also bootstrapped the indirect effect \(ab\) of our example analysis with the SPSS PROCESS macro. The bootstrapped sampling distribution over 5,000 bootstrap samples is shown below.

Indeed, this empirical distribution shows slight negative skewness. Nevertheless, it's reasonably normally distributed but this may be due to our pretty decent sample size of N = 421.
The bootstrapped 95% confidence interval is defined by the 2.5th and 97.5th percentiles of our 5,000 estimates for \(ab\). The PROCESS output is shown below.

Note that the bootstrapped CI is indeed slightly smaller than the one based on the Sobel test, which is [-0.080, -0.017].
Sobel Test in PROCESS Macro
The SPSS PROCESS macro computes the p-value but not the confidence interval for the Sobel test. This is done by adding /normal = 1 to the SPSS syntax for the macro call. This is because the Sobel test is also known as the normal theory test because it relies on \(ab\) being normally distributed.
Anyway. We used the syntax below but you'll probably want to consult SPSS PROCESS Macro Tutorial for replicating our analysis.
set mdisplay tables.
*READ PROCESS DEFINITION.
insert file = 'd:/downloaded/DEFINE-PROCESS-42.sps'.
*RUN PROCESS MODEL 4 (SIMPLE MEDIATION).
!PROCESS
y=wellb
/x=pain
/m=fatigue
/normal = 1 /* INCLUDE SOBEL TEST IN OUTPUT */
/save = 1 /* CREATE NEW DATASET WITH BOOTSTRAP ESTIMATES */
/decimals=F10.4
/boot=5000
/conf=95
/model=4
/seed = 20221227. /* MAKE BOOTSTRAPPING REPLICABLE */
Result

As shown, PROCESS comes up with the same results as our Excel calculator. For some dumb reason, however, it does not report the associated confidence interval for the indirect effect.
Right, I guess that should do regarding the Sobel test. I hope you found this tutorial and our calculator useful. If you've any questions or remarks, please throw us a comment below.
Thanks for reading!
 SPSS TUTORIALS
THIS TUTORIAL HAS 1 COMMENT:
By Angelica Berinde on April 3rd, 2025
Good job.
WE need that