- How to Examine Mediation Effects?
- SPSS Regression Dialogs
- SPSS Mediation Analysis Output
- APA Reporting Mediation Analysis
- Next Steps - The Sobel Test
- Next Steps - Index of Mediation
Example
A scientist wants to know which factors affect general well-being among people suffering illnesses. In order to find out, she collects some data on a sample of N = 421 cancer patients. These data -partly shown below- are in wellbeing.sav.
Now, our scientist believes that well-being is affected by pain as well as fatigue. On top of that, she believes that fatigue itself is also affected by pain. In short: pain partly affects well-being through fatigue. That is, fatigue mediates the effect from pain onto well-being as illustrated below.
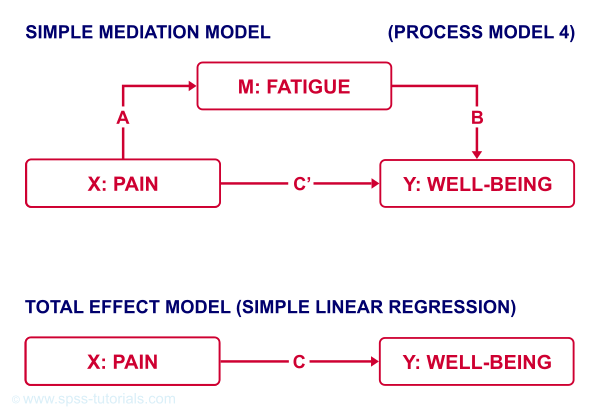
The lower half illustrates a model in which fatigue would (erroneously) be left out. This is known as the “total effect model” and is often compared with the mediation model above it.
How to Examine Mediation Effects?
Now, let's suppose for a second that all expectations from our scientist are exactly correct. If so, then what should we see in our data? The classical approach to mediation (see Kenny & Baron, 1986) says that
- \(a\) (from pain to fatigue) should be significant;
- \(b\) (from fatigue to well-being) should be significant;
- \(c\) (from pain to well-being) should be significant;
- \(c\,'\) (direct effect) should be closer to zero than \(c\) (total effect).
So how to find out if our data is in line with these statements? Well, all paths are technically just b-coefficients. We'll therefore run 3 (separate) regression analyses:
- regression from pain onto fatigue tells us if \(a\) is significant;
- multiple linear regression from pain and fatigue onto well-being tells us if \(b\) and \(c\,'\) are significant;
- regression from pain onto well-being tells if \(c\) is significant and/or different from \(c\,'\).
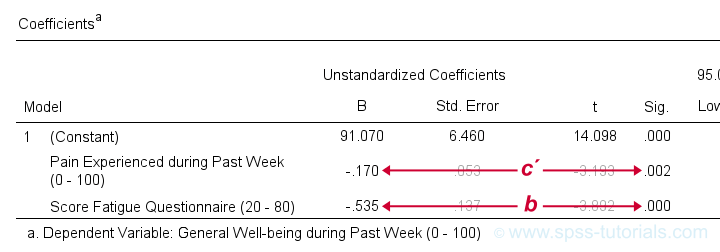 Paths c’ and b in basic SPSS regression output
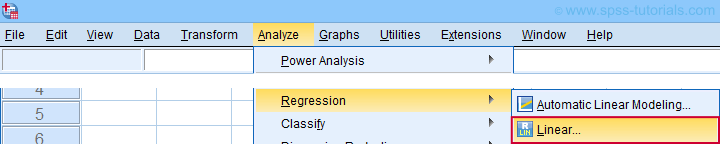
SPSS Regression Dialogs
So let's first run the regression analysis for effect \(a\) (X onto mediator) in SPSS: we'll open wellbeing.sav and navigate to the linear regression dialogs as shown below.
For a fairly basic analysis, we'll fill out these dialogs as shown below.
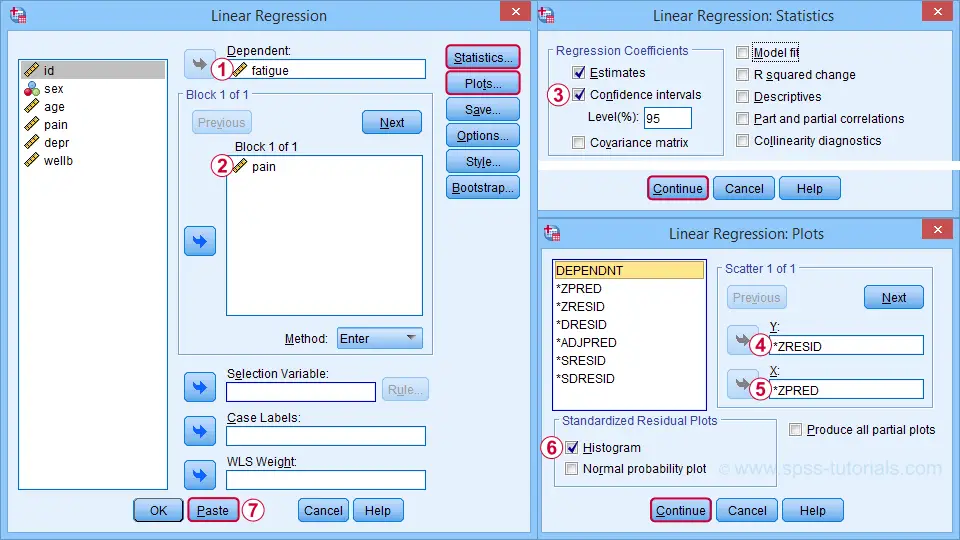
Completing these steps results in the SPSS syntax below. I suggest you shorten the pasted version a bit.
REGRESSION
/MISSING LISTWISE
/STATISTICS COEFF OUTS CI(95) R ANOVA
/CRITERIA=PIN(.05) POUT(.10)
/NOORIGIN
/DEPENDENT fatigue /* MEDIATOR */
/METHOD=ENTER pain /* X */
/SCATTERPLOT=(*ZRESID ,*ZPRED)
/RESIDUALS HISTOGRAM(ZRESID).
*SHORTEN TO SOMETHING LIKE...
REGRESSION
/STATISTICS COEFF CI(95) R
/DEPENDENT fatigue /* MEDIATOR */
/METHOD=ENTER pain /* X */
/SCATTERPLOT=(*ZRESID ,*ZPRED)
/RESIDUALS HISTOGRAM(ZRESID).
A second regression analysis estimates effects \(b\) and \(c\,'\). The easiest way to run it is to copy, paste and edit the first syntax as shown below.
REGRESSION
/STATISTICS COEFF CI(95) R
/DEPENDENT wellb /* Y */
/METHOD=ENTER pain fatigue /* X AND MEDIATOR */
/SCATTERPLOT=(*ZRESID ,*ZPRED)
/RESIDUALS HISTOGRAM(ZRESID).
We'll use the syntax below for the third (and final) regression which estimates \(c\), the total effect.
REGRESSION
/STATISTICS COEFF CI(95) R
/DEPENDENT wellb /* Y */
/METHOD=ENTER pain /* X */
/SCATTERPLOT=(*ZRESID ,*ZPRED)
/RESIDUALS HISTOGRAM(ZRESID).
SPSS Mediation Analysis Output
For our mediation analysis, we really only need the 3 coefficients tables. I copy-pasted them into this Googlesheet (read-only, partly shown below).
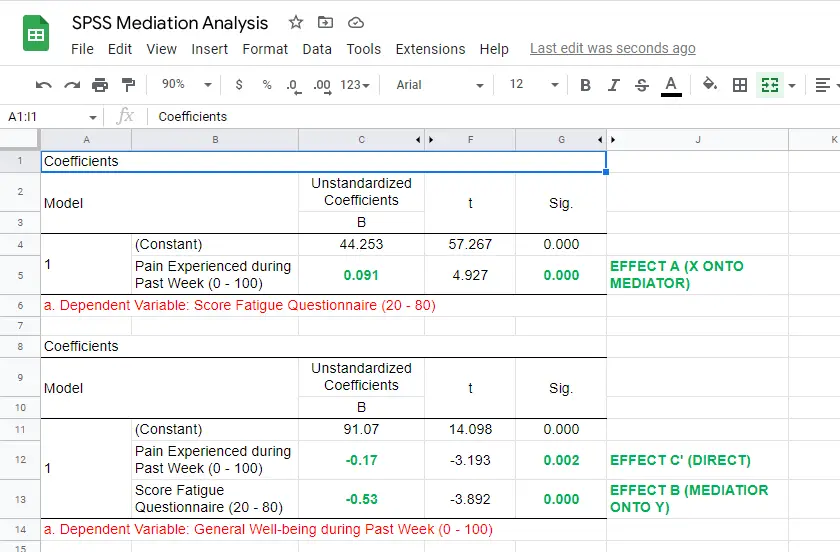
So what do we conclude? Well, all requirements for mediation are met by our results:
- effects \(a\), \(b\) and \(c\) are all statistically significant. This is because their “Sig.” or p < .05;
- the direct effect \(c\,'\) = -0.17 and thus closer to zero than the total effect \(c\) = -0.22.
The diagram below summarizes these results.
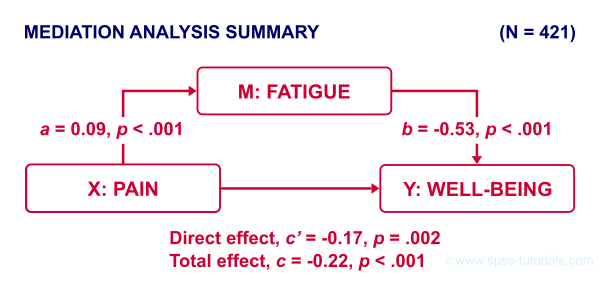
Note that both \(c\) and \(c\,'\) are significant. This is often called partial mediation: fatigue partially mediates the effect from pain onto well-being: adding it decreases the effect but doesn't nullify it altogether.
Besides partial mediation, we sometimes find full mediation. This means that \(c\) is significant but \(c\,'\) isn't: the effect is fully mediated and thus disappears when the mediator is added to the regression model.
APA Reporting Mediation Analysis
Mediation analysis is often reported as separate regression analyses as in “the first step of our analysis showed that the effect of pain on fatigue was significant, b = 0.09, p < .001...” Some authors also include t-values and degrees of freedom (df) for b-coefficients. For some very dumb reason, SPSS does not report degrees of freedom but you can compute them as
$$df = N - k - 1$$
where
- \(N\) denotes the total sample size (N = 421 in our example) and
- \(k\) denotes the number of predictors in the model (1 or 2 in our example).
Like so, we could report “the second step of our analysis showed that the effect of fatigue on well-being was also significant, b = -0.53, t(419) = -3.89, p < .001...”
Next Steps - The Sobel Test
In our analysis, the indirect effect of pain via fatigue onto well-being consists of two separate effects, \(a\) (pain onto fatigue) and \(b\) fatigue onto well-being. Now, the entire indirect effect \(ab\) is simply computed as
$$\text{indirect effect} \;ab = a \cdot b$$
This makes perfect sense: if wage \(a\) is $30 per hour and tax \(b\) is $0.20 per dollar income, then I'll pay $30 · $0.20 = $6.00 tax per hour, right?
For our example, \(ab\) = 0.09 · -0.53 = -0.049: for every unit increase in pain, well-being decreases by an average 0.049 units via fatigue. But how do we obtain the p-value and confidence interval for this indirect effect? There's 2 basic options:
- the modern literature favors bootstrapping as implemented in the PROCESS macro which we'll discuss later;
- the Sobel test (also known as “normal theory” approach).
The second approach assumes \(ab\) is normally distributed with
$$se_{ab} = \sqrt{a^2se^2_b + b^2se^2_a + se^2_a se^2_b}$$
where
\(se_{ab}\) denotes the standard error of \(ab\) and so on.
For the actual calculations, I suggest you try our Sobel Test Calculator.xlsx, partly shown below.
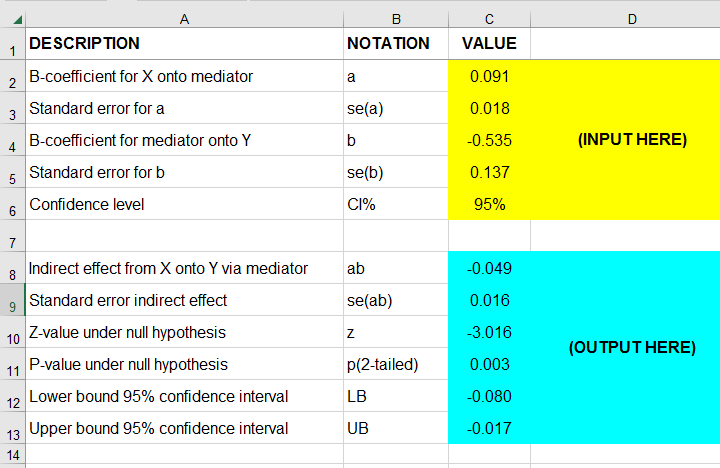
So what does this tell us? Well, our indirect effect is significant, B = -0.049, p = .002, 95% CI [-0.08, -0.02].
Next Steps - Index of Mediation
Our research variables (such as pain & fatigue) were measured on different scales without clear units of measurement. This renders it impossible to compare their effects. The solution is to report standardized coefficients known as β (Greek letter “beta”).
Our SPSS output already includes beta for most effects but not for \(ab\). However, we can easily compute it as
$$\beta_{ab} = \frac{ab \cdot SD_x}{SD_y}$$
where
\(SD_x\) is the sample-standard-deviation of our X variable and so on.
This standardized indirect effect is known as the index of mediation. For computing it, we may run something like DESCRIPTIVES pain wellb. in SPSS. After copy-pasting the resulting table into this Googlesheet, we'll compute \(\beta_{ab}\) with a quick formula as shown below.
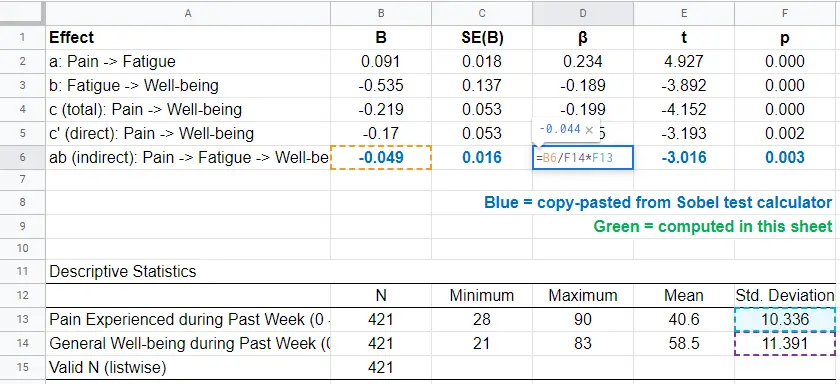
Adding the output from our Sobel test calculator to this sheet results in a very complete and clear summary table for our mediation analysis.
Final Notes
Mediation analysis in SPSS can be done with or without the PROCESS macro. Some reasons for not using PROCESS are that
- many people find PROCESS difficult to use and dislike its output format;
- PROCESS can't create regression residuals and the associated plots for checking regression assumptions such as linearity, homoscedasticity and normality;
- the PROCESS output does not include adjusted r-squared;
- PROCESS does not offer pairwise exclusion of missing values.
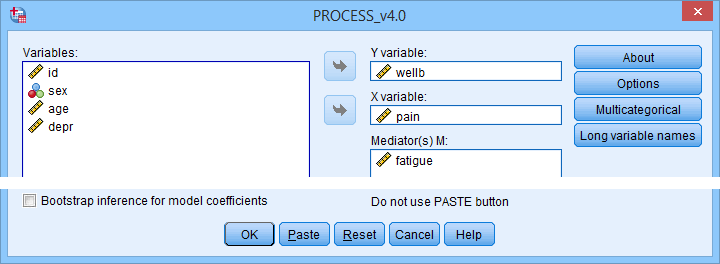
So why does anybody use PROCESS? Some reasons may be that
- PROCESS uses bootstrapping rather than the Sobel test. This is said to result in higher power and more accurate confidence intervals. Sadly, bootstrapping does not yield a p-value for the indirect effect whereas the Sobel test does;
- using PROCESS may save a lot of work for more complex models (parallel, serial and moderated mediation);
- if needed, PROCESS handles dummy coding for the X variable and moderators (if any);
- PROCESS doesn't require the additional calculations that we implemented in our Googlesheet: it calculates everything you need in one go.
Right. I hope this tutorial has been helpful for running, reporting and understanding mediation analysis in SPSS. This is perhaps not the easiest topic but remember that practice makes perfect.
Thanks for reading!
THIS TUTORIAL HAS 3 COMMENTS:
By Per Mathisen on May 5th, 2024
Very simple and good explanation of this topic !
By Breno on July 19th, 2025
Hey there! Nice and clear! I have a question though. When calculating a*b, you used the result of the simple regression (pain on well being) for a, but you used the result of the multiple regression to extract b. Why can't you simply run a simple regression with fatigue onto well being to extract be? Or why not extract the a also from the multiple regression? Thanks in advance
By Ruben Geert van den Berg on July 20th, 2025
Hi Breno!
The dependent variables for a and b are different.
According to the mediation model, the mediator is only affected by X (path a). So that's simple regression.
The Y variable is affected by X (path c') and M (path b). So that's multiple regression.
Does it make any more sense now?