- 1. Set Up Matrix Data File
- 2. SPSS Oneway Dialogs
- 3. Adjusting the Syntax
- 4. Interpreting the Output
In SPSS, you can fairly easily run an ANOVA or t-test without having any raw data. All you need for doing so are
- the sample sizes,
- the means and
- the standard deviations
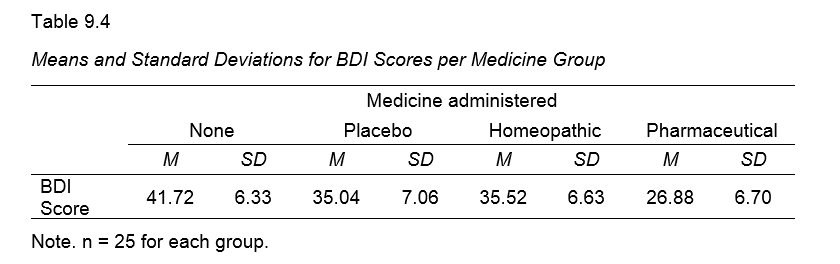
of the dependent variable(s) for the groups you want to compare. This tutorial walks you through analyzing the journal table shown below.
1. Set Up Matrix Data File
First off, we create an SPSS data file containing 3 rows for each group. You may use descriptives-for-anova-01.sav -partly shown below- as a starting point.
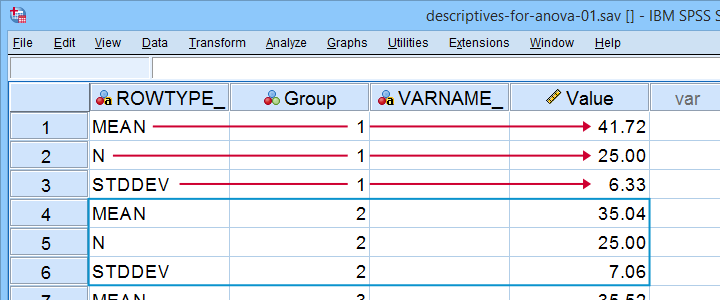
There's 3 adjustments you'll typically want to apply to this example data file:
- removing or adding sets of 3 rows if you want to compare fewer or more groups;
- changing sample sizes, means and standard deviations in the “Value” variable;
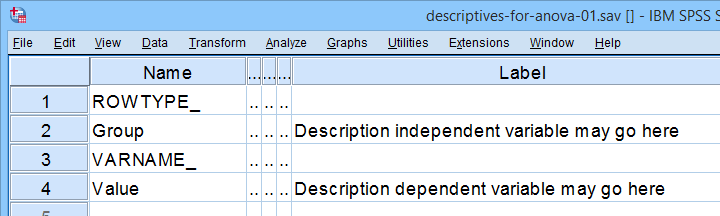
- changing the variable labels for the independent and dependent variables as indicated below.
I recommend you don't make any other changes to this data file or otherwise the final analysis is likely to crash. For instance,
- don't change any variable names;
- don't change the variable order;
- don't remove the empty string variable VARNAME_
2. SPSS Oneway Dialogs
First off, make sure the example data file is the only open data file in SPSS. Next, navigate to
![]()
![]() and fill out the dialogs as if you're analyzing a “normal” data file.
and fill out the dialogs as if you're analyzing a “normal” data file.
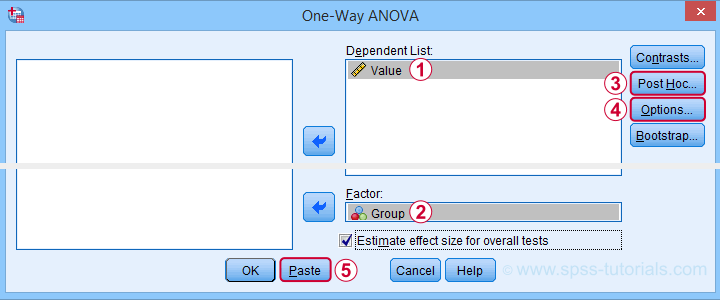
 You may select all options in this dialog. However, Levene's test -denoted as Homogeneity of variances test- will not run as it requires raw data.
This is no problem for the data at hand due to their equal sample sizes. For other data, it may be wise to carefully inspect the Welch test as discussed in SPSS ANOVA - Levene’s Test “Significant”.
Anyway, completing these steps results in the syntax below. But don't run it just yet.
ONEWAY Value BY Group
/ES=OVERALL
/STATISTICS DESCRIPTIVES WELCH
/PLOT MEANS
/MISSING ANALYSIS
/CRITERIA=CILEVEL(0.95)
/POSTHOC=TUKEY ALPHA(0.05).
3. Adjusting the Syntax
Note that we created syntax just like we'd do when analyzing raw data. You could run it, but SPSS would misinterpret the data as 4 groups of 3 observations each. For SPSS to interpret our matrix data correctly, add /MATRIX IN(*). as shown below.
ONEWAY Value BY Group
/ES=OVERALL
/STATISTICS DESCRIPTIVES WELCH
/PLOT MEANS
/CRITERIA=CILEVEL(0.95)
/POSTHOC=TUKEY ALPHA(0.05)
/matrix in(*).
*CORRECTED SYNTAX FOR SPSS 26 OR LOWER.
ONEWAY Value BY Group
/STATISTICS DESCRIPTIVES WELCH
/PLOT MEANS
/CRITERIA=CILEVEL(0.95)
/POSTHOC=TUKEY ALPHA(0.05)
/matrix in(*).
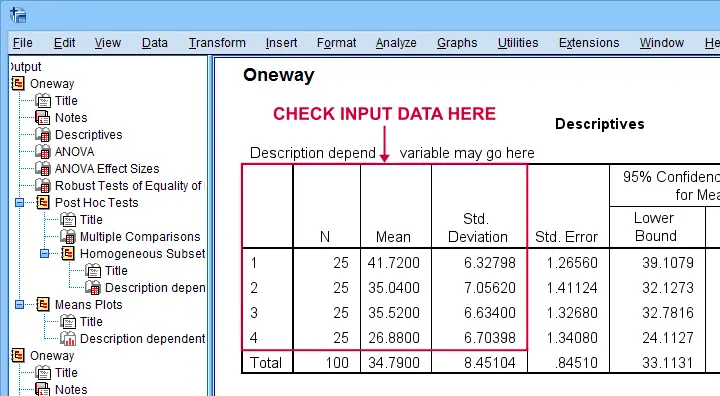
4. Interpreting the Output
First off, note that SPSS has understood that our data file has 4 groups of 25 observations each as shown below.
The remainder of the output is nicely detailed and includes
- the main ANOVA F-test;
- post-hoc tests (Tukey's HSD);
- the Welch test (not really needed for this example);
- a line chart visualizing our sample means;
- various effect size measures such as partial eta squared (only SPSS version 27+).
The main output you cannot obtain from these data are
- Levene's test for the homogeneity assumption;
- the Kolmogorov-Smirnov normality test and;
- the Shapiro-Wilk normality test.
For the sample sizes at hand, however, none of these are very useful anyway. A more thorough interpretation of the output for this analysis is presented in SPSS - One Way ANOVA with Post Hoc Tests Example.
Right, so I hope you found this tutorial helpful. We always appreciate if you throw us a quick comment below. Other that that:
Thanks for reading!
THIS TUTORIAL HAS 11 COMMENTS:
By Ruben Geert van den Berg on March 6th, 2024
Hi Shah, thanks for the compliment!
If you liked this article, you should definitely subscribe to our YouTube channel as well.
We're going to publish a lot of videos over the coming weeks and they're way better than the (older) written articles.
Thanks!
Ruben
SPSS tutorials