This tutorial presents a simple tool for recoding values along with their value labels into different values.
- Prerequisites & Download
- Checking Results & Creating New Variables
- Example I - Reverse Code Variables
- Example II - Correct Order after AUTORECODE
- Example III - Convert 1-2 into 0-1 Coding
- Example IV - Correct Coding Errors with Native Syntax
Example Data
We'll use recode-with-value-labels.sav -partly shown below- for all examples.
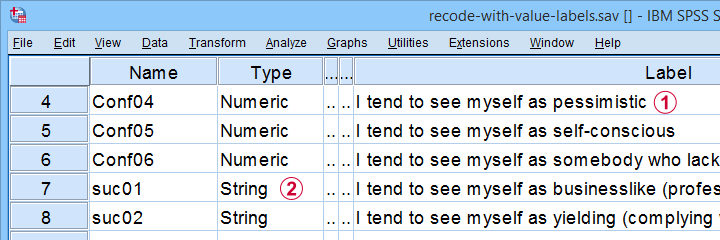
These data contain several common problems:
 Some variables must be reverse coded because they measure the opposite of the other variables within some scale.
 Some ordinal variables are coded as string variables.
The tool presented in this tutorial is the fastest option to fix these and several other common issues.
Prerequisites & Installation
Our recoding tool requires SPSS version 24+ with the SPSS Python 3 essentials properly installed -usually the case with recent SPSS versions.
Next, download our tool from SPSS_TUTORIALS_RECODE_WITH_VALUE_LABELS.spe. You can install it by dragging & dropping it into a data editor window. Alternatively, navigate to
![]() as shown below.
as shown below.
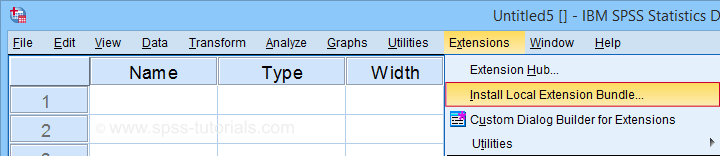
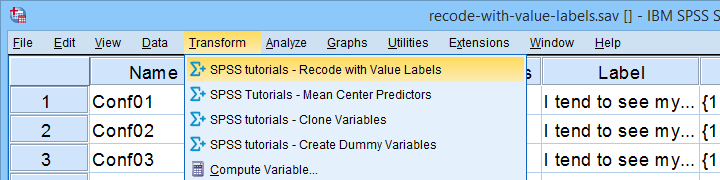
In the dialog that opens, navigate to the downloaded .spe file and select it. SPSS now throws a message that “The extension was successfully installed under Transform - SPSS tutorials - Recode with Value Labels”. You'll now find our tool under
![]() as shown below.
as shown below.
Checking Results & Creating New Variables
If you use our tool, you may want to verify that all result are correct. A basic way to do so is to compare some frequency distributions before and after recoding your variables. These will be identical (except for their order) if you show only value labels in your output.
Our tool modifies existing variables instead of creating new ones. If that's not to your liking, combine it with our SPSS Clone Variables Tool (shown below).
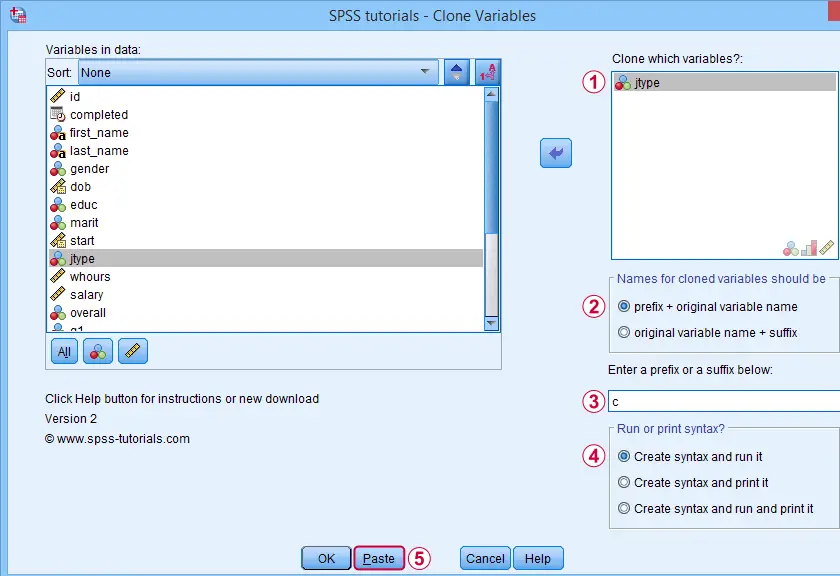
A very solid strategy is now to
- clone all variables you'd like to recode;
- recode the original (rather than the cloned) variables with our recoding tool;
- compare the recoded variables with their cloned counterparts with CROSSTABS;
- optionally: remove the cloned variables from your data when you're done.
Ok, so let's now see how our recoding tool solves some common data problems.
Example I - Reverse Code Variables
Conf01 to Conf06 are intended to measure self confidence. However, Conf04 and Conf06 indicate a lack of self confidence and correlate negatively with the other confidence items.
This issue is solved by reverse coding these items. After installing our tool, let's first navigate to
![]() Next, we'll fill out the dialogs as shown below.
Next, we'll fill out the dialogs as shown below.
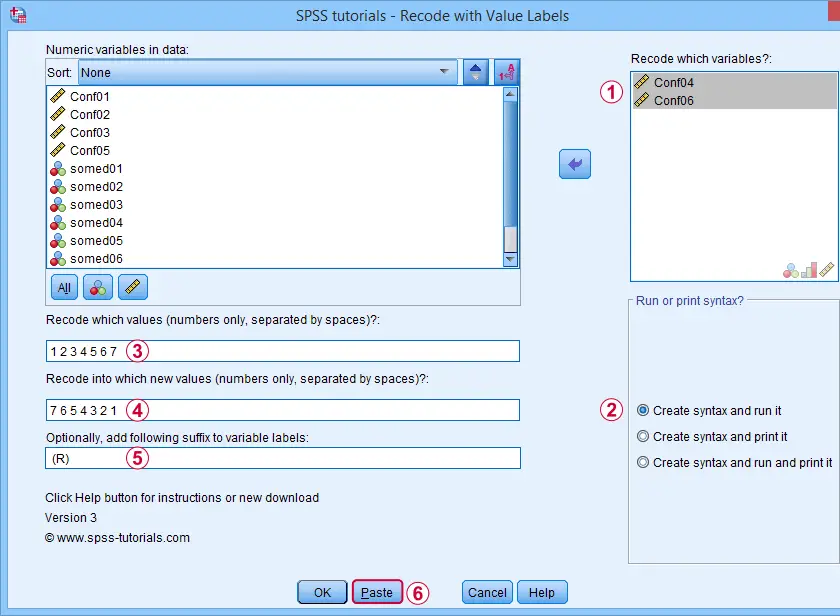
 Excluding the user missing value of 8 (No answer) leaves this value and its value label unaltered.
Completing these steps results in the syntax below. Let's run it.
SPSS TUTORIALS RECODE_WITH_VALUE_LABELS VARIABLES=Conf04 Conf06 OLDVALUES=1 2 3 4 5 6 7 NEWVALUES=7
6 5 4 3 2 1
/OPTIONS LABELSUFFIX=" (R)" ACTION=RUN.
Result
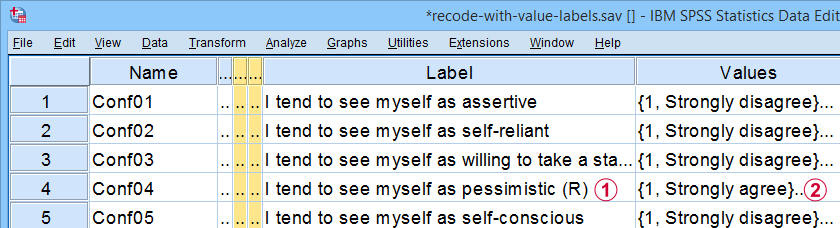
Note that (R) is appended to the variable labels of our reverse coded variables;
The values and value labels have been reversed as well.
Our reverse coded items now correlate positively with all other confidence items as required for computing Cronbach’s alpha or a mean or sum score over this scale.
Example II - Correct Order after AUTORECODE
Another common issue are ordinal string variables in SPSS such as suc01 to suc06 which measure self-perceived successfulness. First off, let's convert them to labeled numeric variables by navigating to
![]() Next, we'll create an AUTORECODE command for a single variable as shown below.
Next, we'll create an AUTORECODE command for a single variable as shown below.
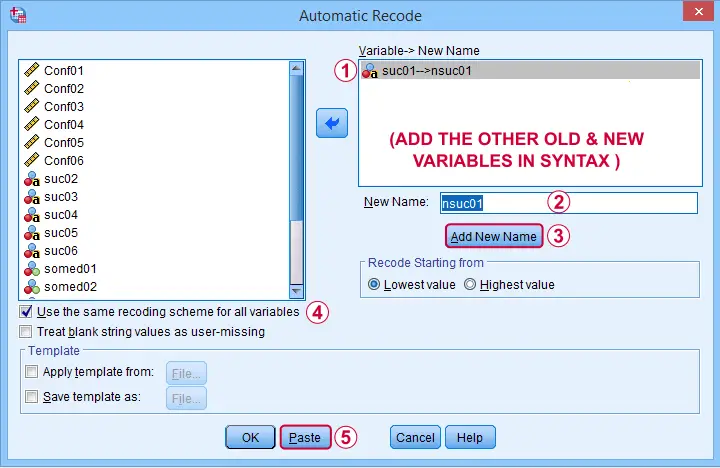
We can now easily add the remaining 5 variables to the resulting SPSS syntax as shown below. Let's run it.
AUTORECODE VARIABLES=suc01 to suc06 /* ADD ALL OLD VARIABLES HERE */
/INTO nsuc01 to nsuc06 /* ADD ALL NEW VARIABLES HERE */
/GROUP
/PRINT.
This syntax converts our string variables into numeric ones but the order of the answer categories is not as desired. For correcting this, we first copy-paste our new, numeric values into Notepad++ or Excel. This makes it easy to move them into the desired order as shown below.
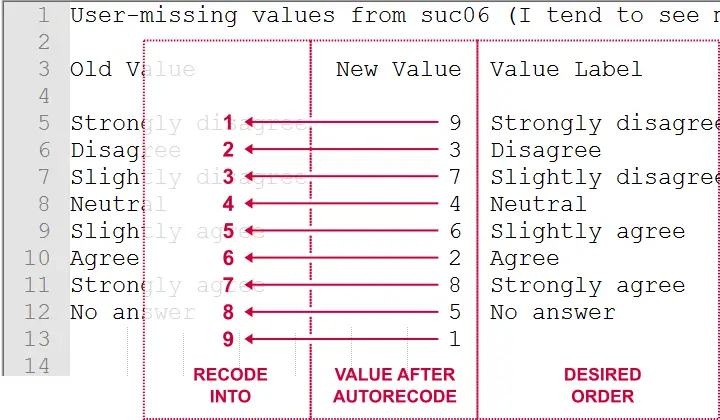
Doing so makes clear that we need to
- convert 9 into 1,
- convert 3 into 2,
- convert 7 into 3,
- and so on...
The figure below shows how to do so with our recoding tool.
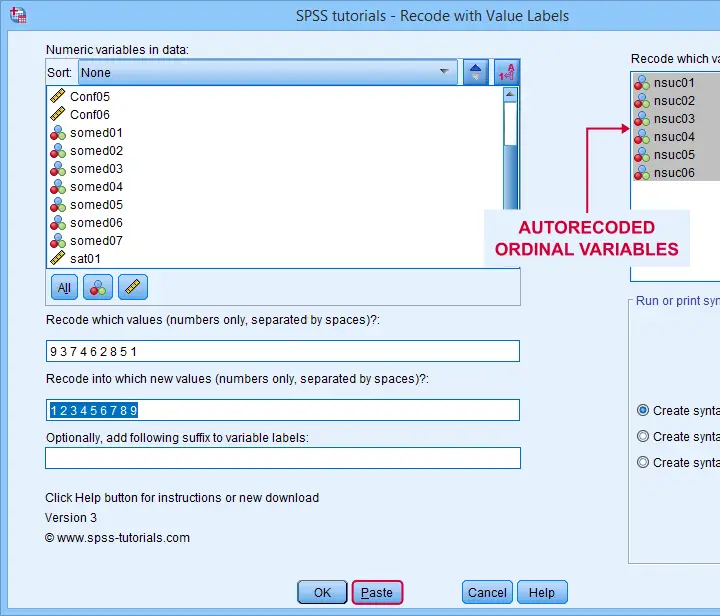
This results in the syntax below, which sets the correct order for our autorecoded numeric variables.
SPSS TUTORIALS RECODE_WITH_VALUE_LABELS VARIABLES=nsuc01 nsuc02 nsuc03 nsuc04 nsuc05 nsuc06
OLDVALUES=9 3 7 4 6 2 8 5 1 NEWVALUES=1 2 3 4 5 6 7 8 9
/OPTIONS ACTION=RUN.
Example III - Convert 1-2 into 0-1 Coding
In SPSS, we preferably use a 0-1 coding for dichotomous variables. Some reasons are that
- this facilitates interpreting b-coefficients for dummy variables in multiple regression;
- means for 0-1 coded variables correspond to proportions of “yes” answers which are easily interpretable.
The syntax below is easily created with our recoding tool and converts the 1-2 coding for all dichotomous variables in our data file into a 0-1 coding.
SPSS TUTORIALS RECODE_WITH_VALUE_LABELS VARIABLES=somed01 somed02 somed03 somed04 somed05 somed06
somed07 OLDVALUES=2 NEWVALUES=0
/OPTIONS ACTION=RUN.
Example IV - Correct Coding Errors with Native Syntax
If we take a close look at our final variable, sat01, we see that it is coded 21 through 27. Depending on how we analyze it, we may want to convert it into a standard 7-point Likert scale. The screenshot below shows how it's done.
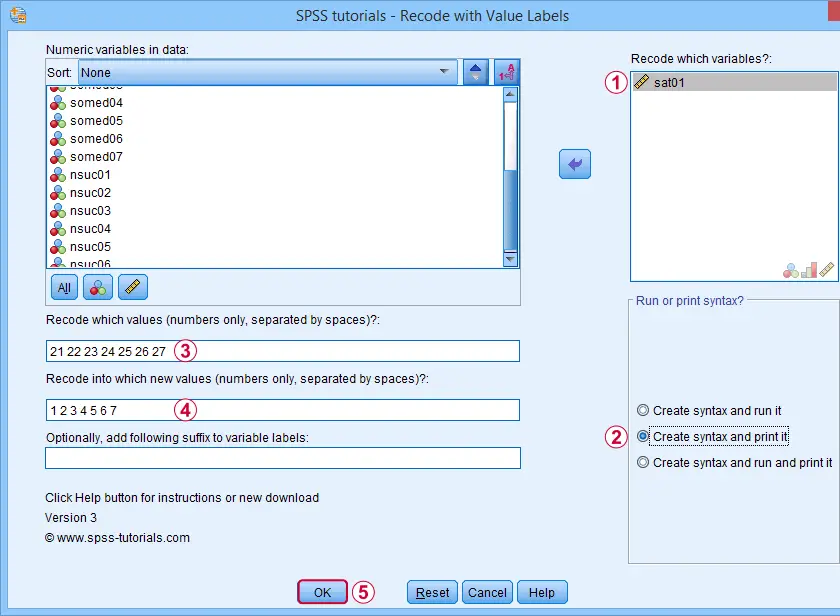
Note that we select “Create syntax and print it” for creating native syntax.
Result
As shown below, selecting the print option results in native SPSS syntax in your output window.
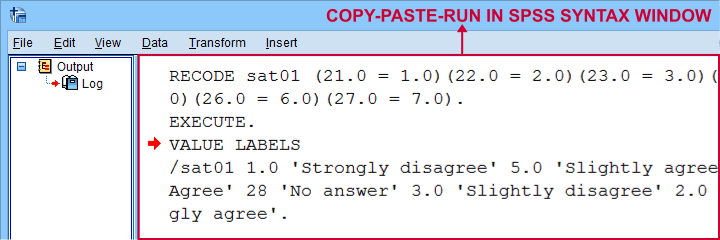
The syntax we thus copy-pasted from our output window is:
RECODE sat01 (21.0 = 1.0)(22.0 = 2.0)(23.0 = 3.0)(24.0 = 4.0)(25.0 = 5.0)(26.0 = 6.0)(27.0 = 7.0).
EXECUTE.
VALUE LABELS
/sat01 1.0 'Strongly disagree' 2.0 'Disagree' 3.0 'Slightly disagree' 4.0 'Neutral' 5.0 'Slightly agree' 6.0 'Agree' 7.0 'Strongly agree'.
Note that it consists of 3 very basic commands:
- RECODE adjusts the values themselves;
- EXECUTE can usually be removed from the syntax but it ensures that our RECODE is executed immediately;
- VALUE LABELS adjusts our value labels after our RECODE.
So why should you consider using the print option? Well, the default syntax created by our tool only runs on SPSS installations with the tool installed. So if a client or colleague needs to replicate your work,
using native syntax ensures that everything will run
on any SPSS installation.
Right, so that should do. I hope you'll find my tool helpful -I've been using it on tons of project myself. If you've any questions or remarks, just throw me a comment below, ok?
Thanks for reading!
THIS TUTORIAL HAS 21 COMMENTS:
By Ruben Geert van den Berg on March 28th, 2023
Hi Jon!
Thanks for letting me know.
However, I'm very happy with my own tool: it's super simple and I like that it can create "native" syntax.
Like so, I can use it for my clients without them having to install any extension(s) in order to replicate my work.
I've been using this on tons of projects, often combined with our SPSS Clone Variables Tool.
Separating these functionalities keeps both of them simple enough for even novice end users. I kinda prefer that over combining all functionalities into a single tool, which has a tendency to complicate things...
P.s. we also have/use a tool for adjusting many variable/value labels in one go, also separately from the aforementioned tools.