IBM SPSS Statistics (or “SPSS” for short) is super easy software for editing and analyzing data.
This tutorial presents a quick overview of what SPSS looks like and how it basically works.
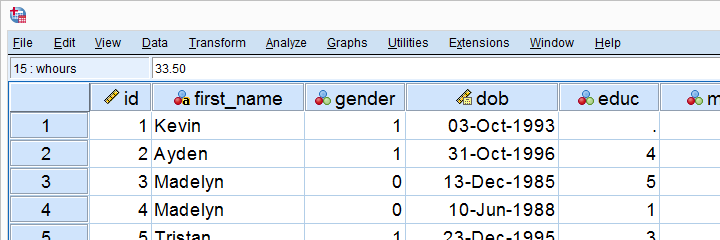
SPSS’ main window is the data editor. It shows our data so we can visually inspect it.
This tutorial explains how the data editor works: we'll walk you through its main parts and point out some handy tips & tricks.
SPSS syntax is computer code used by SPSS for analyzing data, editing data, running statistical tests and more.
Using SPSS syntax is super easy and saves tons of time and effort. This tutorial quickly gets you started!
SPSS’ output window shows the tables, charts and statistical tests you run while analyzing your data.
This tutorial walks you through some basics such as exporting tables and charts to WORD or Excel. We'll also point out some important tricks such as batch editing and styling tables and charts.
Levene’s test examines if 2+ populations have equal variances on some variable.
This condition -known as the homogeneity of variance assumption- is required by t-tests and ANOVA.
So how to run and interpret this test in SPSS? This simple tutorial quickly walks you through.
Factor analysis examines which variables in your data measure which underlying factors.
This tutorial illustrates the ideas behind factor analysis with a simple step-by-step example in SPSS.
In SPSS, missing values refer to
We'll quickly walk you through both types. We'll also show how to detect, set and deal with missing values in SPSS.
The Shapiro-Wilk test examines if a variable is normally distributed in a population. This assumption is required by some statistical tests such as t-tests and ANOVA.
The SW-test is an alternative for the Kolmogorov-Smirnov test. This tutorial shows how to run and interpret it in SPSS.
The Kolmogorov-Smirnov test examines if a variable is normally distributed in some population.
This “normality assumption” is required for t-tests, ANOVA and many other tests. This tutorial shows how to run and interpret a Kolmogorov-Smirnov test in SPSS with some simple examples.
In SPSS, IF computes a new or existing variable but for a selection of cases only.
For example: IF(GENDER = 0) SCORE = MEAN(Q1 TO Q5). computes “score” as the mean over variables Q1 to Q5 but only for cases whose gender is 0 (female).
SPSS FILTER excludes a selection of cases from all subsequent analyses until you switch it off again.
Using a filter comes down to creating a (new) filter variable and activating it. This tutorial shows the easy way to do so and points out some nice alternatives as well.
In SPSS, SELECT IF removes a selection of cases from your data.
This tutorial walks you through the basics and some FAQ's such as
Effect size is an interpretable number that quantifies the difference between data and some hypothesis.
Effect size measures are useful for comparing effects across and within studies. This tutorial helps you to choose, obtain and interpret an effect size for each major statistical procedure.
Cohen’s D is the effect size measure of choice for t-tests.
This simple tutorial quickly walks you through
THIS TUTORIAL HAS 119 COMMENTS:
By Alemu on February 17th, 2022
It is good
By syed ahsan raza shah on February 19th, 2022
just learning
By Iamtennyhorlar on March 12th, 2022
Please I need a steady tutorial class
By Adugna on March 25th, 2022
Excellent
By Darius on April 6th, 2022
the software is useful