 SPSS TUTORIALS
How to Convert String Variables into Numeric Ones?
Introduction & Practice Data File
Converting an SPSS string variable into a numeric one is simple. However, there's a huge pitfall that few people are aware of: string values that can't be converted into numbers result in system missing values without SPSS throwing any error or warning.
This can mess up your data without you being aware of it. Don't believe me? I'll demonstrate the problem -and the solution- on convert-strings.sav, part of which is shown below.
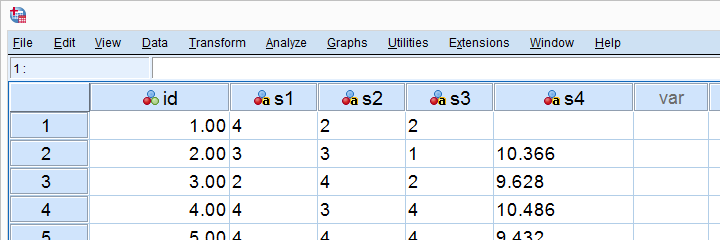
SPSS Strings to Numeric - Wrong Way
First off, you can convert a string into a numeric variable in variable view as shown below.
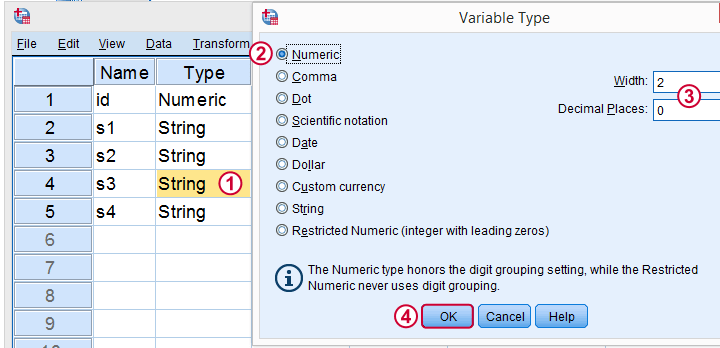
Now, I never use this method myself because
- I can't apply it to many variables at once, so it may take way more effort than necessary;
- it doesn't generate any syntax: there's no button and nothing's appended to my journal file;
- it can mess up the data. However, there's remedies for that.
So What's the Problem?
Well, let's do it rather than read about it. We'll
- set empty cells as user missing values for s3;
- convert s3 to numeric in variable view;
- run descriptives on the result.
missing values s3 ('').
*Inspect frequency table for s3.
frequencies s3.
*Now manually convert s3 to numeric under variable view.
*Inspect result.
descriptives s3.
*N = 444 instead of 459. That is, 15 values failed to convert and we've no clue why.
Result
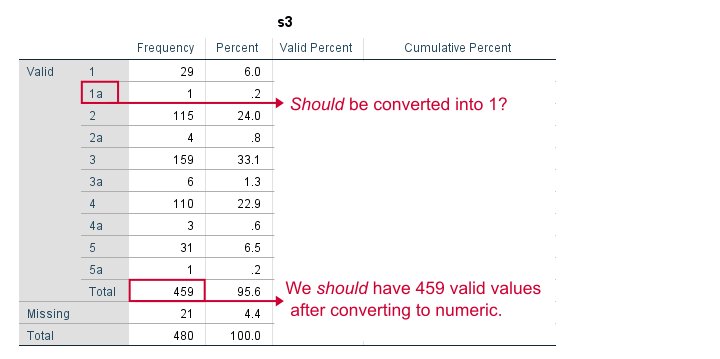
Note that some values in our string variable have been flagged with “a”. We probably want these to be converted into numbers. We have 459 valid values (non empty cells).
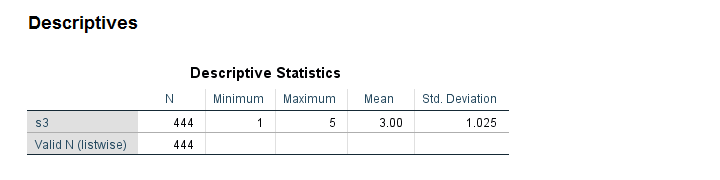
After converting our variable to numeric, we ran some descriptives. Note that we only have N = 444. Apparently, 15 values failed to convert -probably not what we want. And we usually won't notice this problem because we don't get any warning or error.
Conversion Failures - Simplest Solution
Right, so how can we perform the conversion safely? Well, we just
- inspected frequency tables: how many non empty values do we have before the conversion?
- converted our variable(s) to numeric;
- inspected N in a descriptive statistics after the conversion. If N is lower than the number of non empty string values (frequencies before conversion), then something may be wrong.
In our first example, the frequency table already suggested we must remove the “a” from all values before converting the variable. We'll do just that in a minute.
Although safe, I still think this method is too much work, especially for multiple variables. Let's speed things up by using some handy syntax.
SPSS - String to Numeric with Syntax
The fastest way to convert string variables into numeric ones is with the ALTER TYPE command.This requires SPSS version 16 or over. For SPSS 15 or below, use the NUMBER function. It allows us to convert many variables with a single line of syntax.
The syntax below converts all string variables in one go. We then check a descriptives table. If we don't have any system missing values, we're done.
SPSS ALTER TYPE Example
*Convert all variables in one go.
alter type s1 to s3 (f1) s4 (f6.3).
*Inspect descriptives.
descriptives s1 to s4.
Note: using alter type s1 to s4 (f1). will also work but the decimal places for s4 won't be visible. This is why we set the correct f format: f6.3 means 6 characters including the decimal separator and 3 decimal places as in 12.345. Which is the format of our string values.
Result
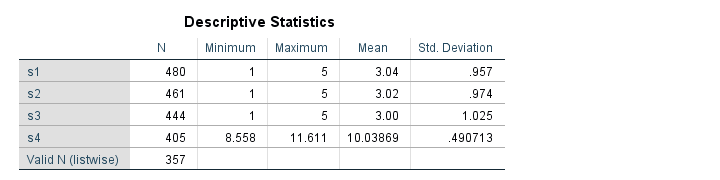
Since we've 480 cases in our data, we're done for s1. However, the other 3 variables contain system missings so we need to find out why. Since we can't undo the operation, let's close our data without saving and reopen it.
Solution 2: Copy String Variables Before Conversion
Things now become a bit more technical. However, readers who struggle their way through will learn a very efficient solution that works for many other situations too. We'll basically
- copy all string variables;
- convert all string variables;
- compare the original to the converted variables.
Precisely, we'll flag non empty string values that are system missing after the conversion. As these are at least suspicious, we'll call those conversion failures. This may sound daunting but it's perfectly doable if we use the right combination of commands. Those are mainly STRING, RECODE, DO REPEAT and IF.
Copy and Convert Several String Variables
*Copy all string variables.
string c1 to c4 (a7).
recode s1 to s4 (else = copy) into c1 to c4.
*Convert variables to numeric.
alter type s1 to s3 (f1) s4 (f6.3).
*For each variable, flag conversion failures: cases where converted value is system missing but original value is not empty.
do repeat #conv = s1 to s4 / #ori = c1 to c4 / #flags = flag1 to flag4.
if(sysmis(#conv) and #ori <> '') #flags = 1.
end repeat.
*If N > 0, conversion failures occurred for some variable.
descriptives flag1 to flag4.
Result
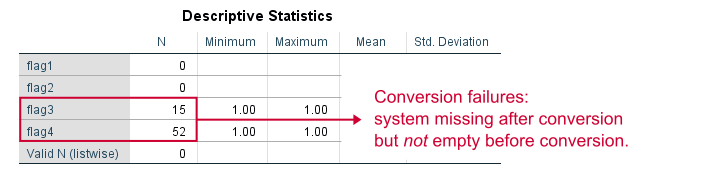
Only flag3 and flag4 contain some conversion failures. We can visually inspect what's the problem by moving these cases to the top of our dataset.
sort cases by flag3 (d).
*Some values flagged with 'a'.
sort cases by flag4 (d).
*Some values flagged with 'a' through 'e'.
Result
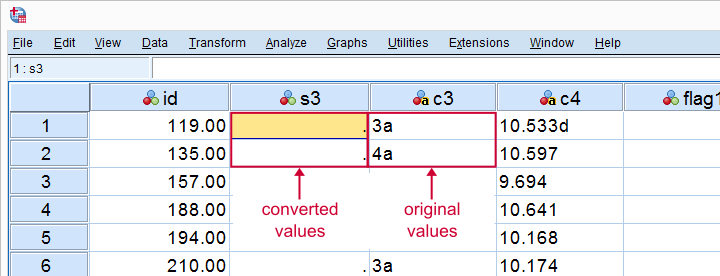
Remove Illegal Characters, Copy and Convert
Some values are flagged with letters “a” through “e”, which is why they fail to convert. We'll now fix the problem. First, we close our data without saving and reopen it. We then rerun our previous syntax but remove these letters before the conversion.
Syntax
*Copy all stringvars.
string c1 to c4 (a7).
recode s1 to s4 (else = copy) into c1 to c4.
*Remove 'a' from s3.
compute s3 = replace(s3,'a','').
*Remove 'a' through 'e' from s4.
do repeat #char = 'a' 'b' 'c' 'd' 'e'.
compute s4 = replace(s4,#char,'').
end repeat.
*Try and convert variable again.
alter type s1 to s3 (f1) s4 (f6.3).
*Flag conversion failures again.
do repeat #conv = s1 to s4 / #ori = c1 to c4 / #flags = flag1 to flag4.
if(sysmis(#conv) and #ori <> '') #flags = 1.
end repeat.
*Inspect if conversion succeeded.
descriptives flag1 to flag4.
*N = 0 for all flag variables so we're done.
*Delete copied and flag variables.
delete variables c1 to flag4.
Result

All flag variables contain only (system) missings. This means that we no longer have any conversion failures; all variables have been correctly converted. We can now delete all copy and flag variables, save our data and move on.
Thanks for reading!
SPSS 26 – Review of SPSS’ New Interface
SPSS 26 comes in both a new and the classic interface. We downloaded and tested the new interface. This review walks you through our main findings.
- SPSS 26 - Which “Subscription” Am I On?
- SPSS 26 - Data View & Variable View Tabs
- SPSS 26 - Menus & Dialogs
- SPSS 26 Output Tab - Tables & Charts
- SPSS 26 - The Analyze Catalog
- SPSS 26 - Conclusions
SPSS 26 - Which “Subscription” Am I On?
When downloading SPSS 26, we're offered both the new as well as the classic interface. Curiously, the IBM website mentions “SPSS Subscription” rather than “SPSS 26”.
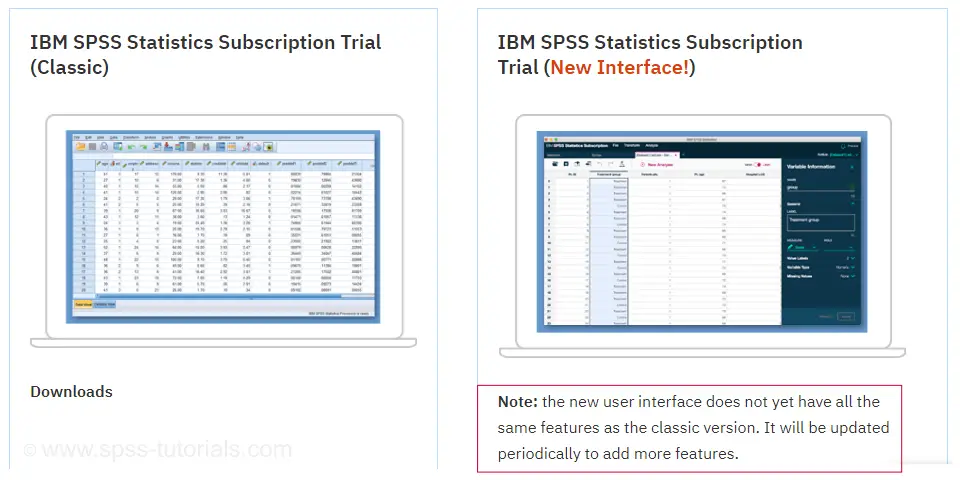
Before downloading it, we're already warned that the new interface “does not yet have all the same features” as the classic version. Well, ok. There's probably some tiny details they still need to work on. But they wouldn't launch a half-baked software package. Would they?
Anyway, we installed both versions and after doing so, our SPSS statistics directory looks like below.
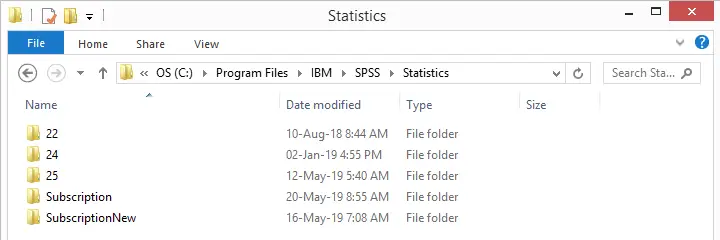
I was expecting a subfolder named 26 but instead I've Subscription and SubscriptionNew for the classic and new interfaces. It kinda makes me wonder
is this actually SPSS 26?
For SPSS 25 and older, this was always crystal clear: these versions mention their version number when starting or closing the program. In the middle of a session, navigating to
 shows the exact release such as 25.0.0.1. Alternatively, running the
show license. syntax would also do the trick.
shows the exact release such as 25.0.0.1. Alternatively, running the
show license. syntax would also do the trick.
In the new interface, none of those options come up with anything but “IBM SPSS Statistics”. However, when digging into the backend subfolder, we found stats.exe, the actual application. And when we hovered over the file, we saw this:
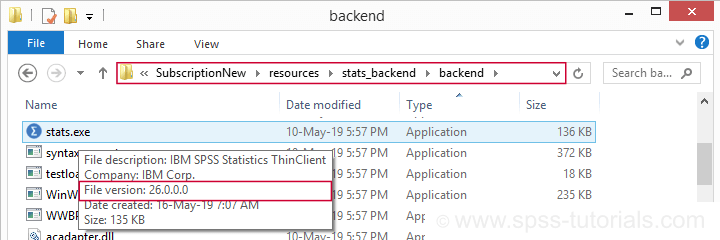
SPSS 26 indeed. But why do I even want to know my exact version number? Well,
- if something does not work in my SPSS version, I want to Google something like “SPSS 26 font size data editor”. If I can't add my version number to that, I'll get solutions for other SPSS versions that don't solve my problem.
- Second, if I want to help out my clients, their version numbers tell me what will (not) work for them.
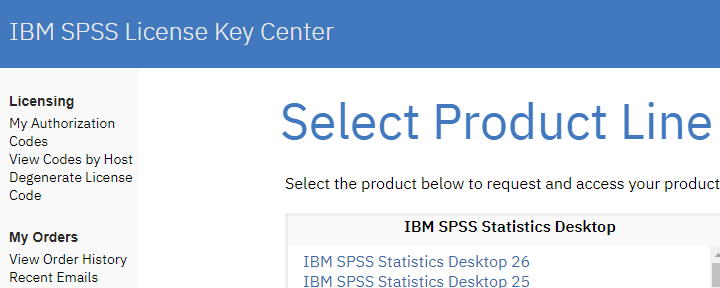
- And -finally- the IBM license key center only offers me an authorization code for IBM SPSS Statistics Desktop 26. It does not mention any “Subscription” (see below).
SPSS 26 - Data View & Variable View Tabs
Anway, we downloaded and installed the SPSS 26 with the new interface. After opening some data, we get the data view tab shown below.
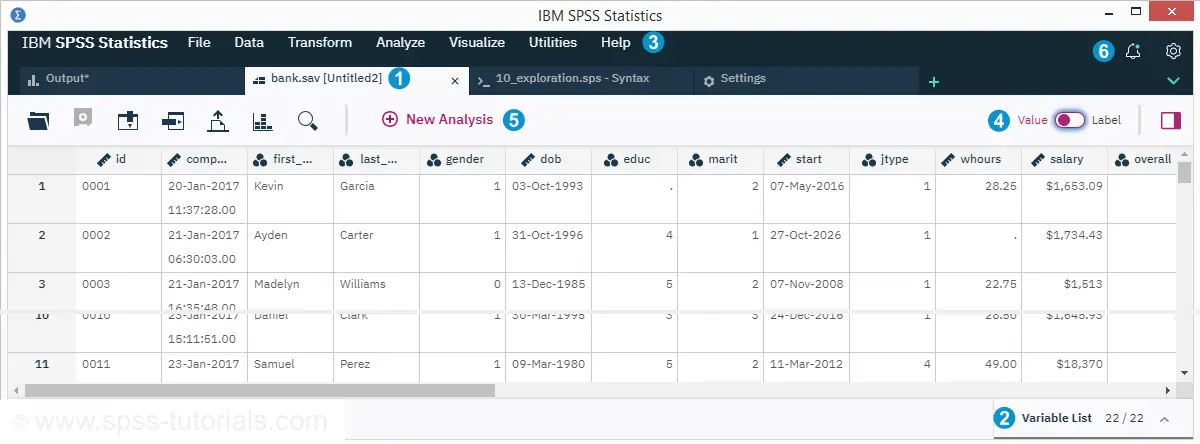
 The new interface is based on tabs rather than (data, syntax and output) windows. As we'll see in a minute, settings and dialogs also come as tabs.
 Variable view is below data view and slides up upon clicking it. We didn't discover any shortcut for doing so.
 The and menus are absent. I suppose they'll be added later. But for now, this really is a huge problem.
 The value/label switch does not toggle between values and value labels but -rather- between variable names and variable labels.
 An Analyze Catalog has been added.
 There's notifications and settings icons. However, these settings don't include the essential settings under
in previous SPSS versions. These seem unavailable in the new interface.
There's notifications and settings icons. However, these settings don't include the essential settings under
in previous SPSS versions. These seem unavailable in the new interface.
SPSS 26 - Data View Issues
Even this very first exploration of the new interface resulted in some serious issues.
- First off, my laptop has a 1920 by 1080px screen resolution. As a result, the font sizes are way too small on my screen. Since there's no menu -the only way to set larger font sizes- this makes the new data view pretty useless for me.
- Second, it seems impossible to have multiple syntax tabs open simultaneously. Whenever I open another syntax file, the open syntax tab closes, asking me whether to save its contents.
- Third, my OUTPUT CLOSE command
triggers the error that it's no longer available. That sucks. I always start new projects with closing all open output and datasets. Some of my clients do the same. - Fourth, I like to toggle a lot between data view and variable view but -as mentioned- the Ctrl + t shortkey no longer works.
SPSS 26 - Variable View
In SPSS’ new interface, variable view is called “Variable List”. It's in the same tab as data view and slides up when clicked. Unfortunately, it no longer has the clear and simple structure known from previous SPSS versions.
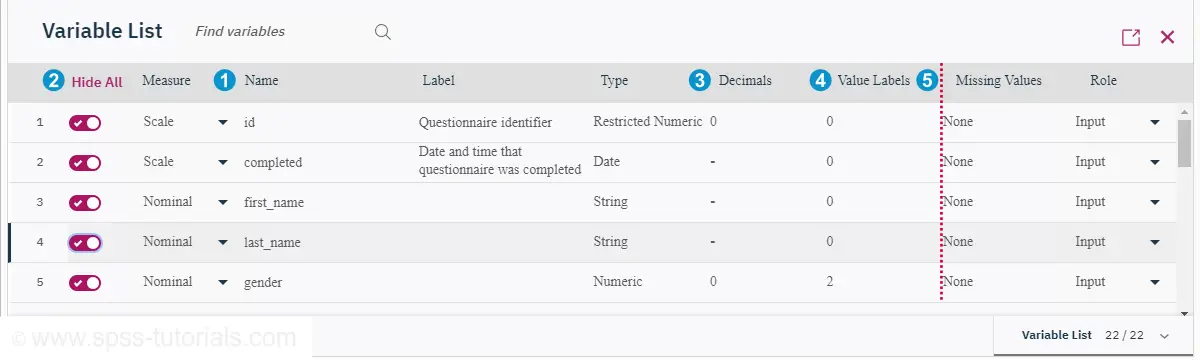
The order of variable properties has been altered with visibility and measurement levels before variable names.
The ability to hide variables is a welcome new feature. But what's the syntax for doing so? How to hide, say, v1 to v25 but not v26 to v50? That can't require 25 mouse clicks, right?
Width and columns have been removed. However, we'll get to those in a minute.
The value labels column is finally called “Value Labels” rather than “Values”. It now shows the number of labels defined for each variable.
Apart from the weird Serif fonts in Variable List, the alignment looks odd too: it seems some column headers are centered with their property values left aligned. Together with removing the classic grid, this doesn't contribute to a nice and clear interface.
We also noticed that clicking “Type” -which either refers to a variable type or format- opens up the dialog shown below.
 Variable type, width and format are shown when clicking “Type” in Variable List.
Note that a much better way to set formats and types are the FORMATS and ALTER TYPE commands: these can address many variables in one go and they are replicable.
SPSS 26 - Menus & Dialogs
For the most part, the new menus look like the old menus but incomplete and badly reorganized. For instance, let's take a look at as shown below.
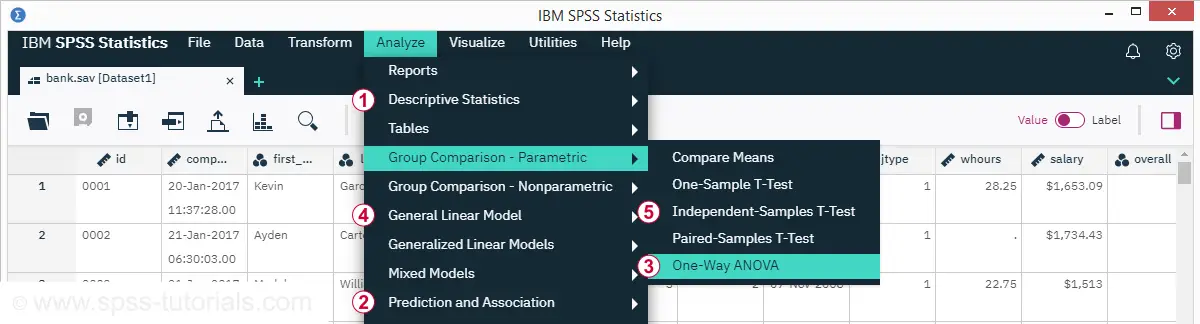
The most sought-after analyses in SPSS are
 The chi-square independence test -deeply hidden under Analyze
Descriptive statistics
Crosstabs.
The chi-square independence test -deeply hidden under Analyze
Descriptive statistics
Crosstabs.
 Correlations, now hidden under Prediction and Association.
Regression, also under Prediction and Association.
 ANOVA, scattered over Group Comparison - Parametric and
  General Linear Model.
The independent samples t-test under Group Comparison - Parametric.
So why are the most popular analyses so hard to find? They're not meant to be literally “sought after”. These analyses should be listed at the top level of Analyze. Instead -however- Correlate and Regression have actually been removed from it.
SPSS 26 - Dialogs
The new dialogs look different from previous versions. Let's take a look at the Correlations dialog below.
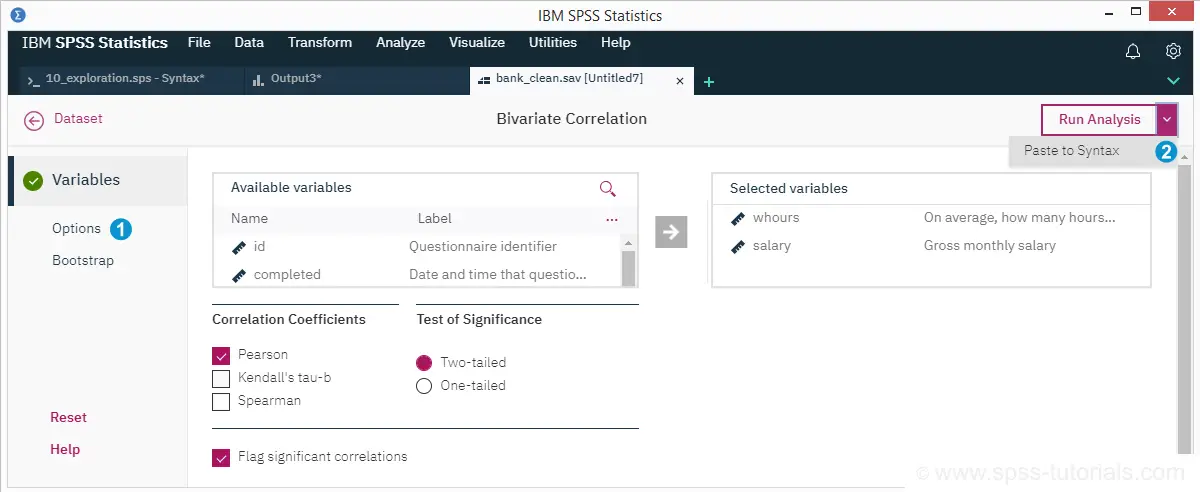
To our disappointment, the Options are still the same as in previous versions. And they are not good: regardless of what we need, we always get all significance levels in our output. Confidence intervals for correlations are still not available. We still can't choose whether we want any sample sizes included in our output table.
The classic functions such as Help and Ok are somewhat scattered over the dialog. Unfortunately, “Paste to syntax” is hidden under “Run Analysis” so this now takes 2 clicks instead of 1. The Alt based shortkeys and Esc no longer work either.
SPSS 26 Output Tab - Tables & Charts
After running our analysis, we're presented with the output tab shown below.
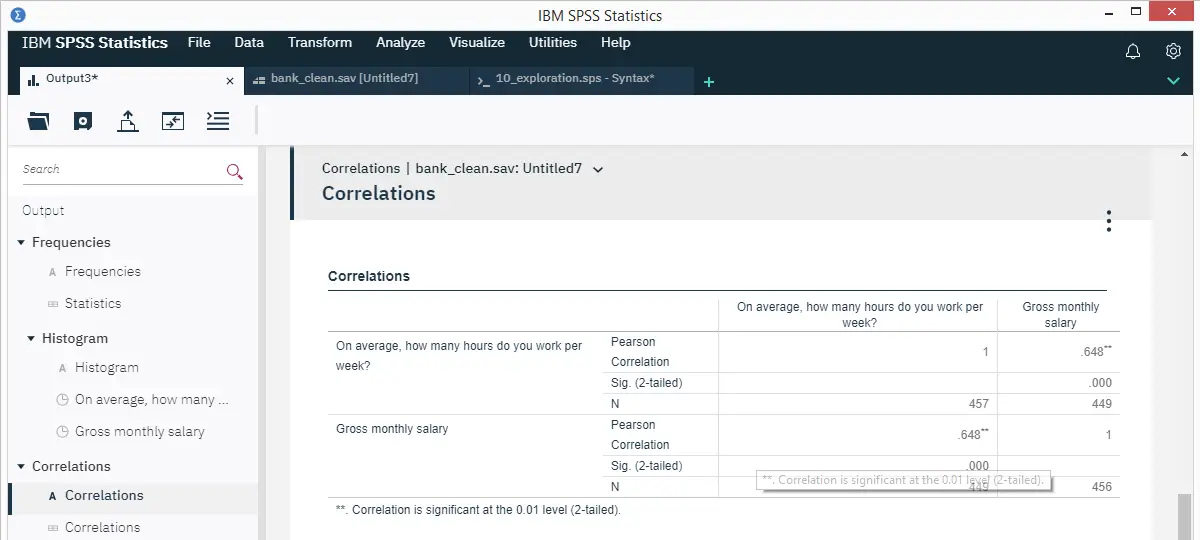
The output outline looks pretty nice and clean. However, when right-clicking an item, the OMS labels don't show up. For experienced users, this complicates batch editing tables with OUTPUT MODIFY.
The correlation table itself looks much better than previous SPSS versions as well. However, we stumbled upon some issues here too:
- Essential table editing functionality has disappeared. We managed to transpose the table but we can't rearrange its dimensions via Pivoting trays. Meeting APA standards for correlation tables is pretty much impossible from SPSS’ new interface.
- Tablelooks no longer seem to work, neither via the menu nor via syntax.
SPSS 26 - Charts
As shown below, charts still don't look too great in SPSS 26.
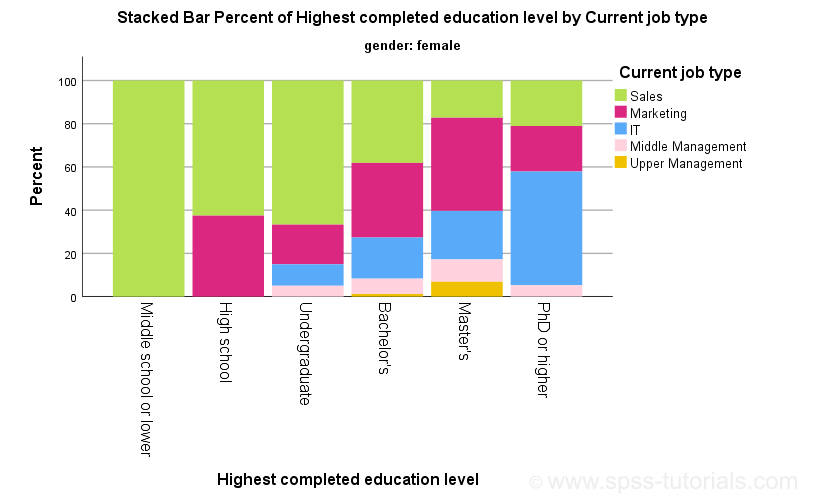
None of the issues discussed in New Charts in SPSS 25 - How Good Are They Really? have been resolved: still no percent sign on the y-axis. Still the wrong title. And so on.
More worrying, the SPSS 26 menu only includes the Chart builder. I sure hope the legacy dialogs will soon be added: they are much simpler and result in short and clean syntax that's copy-paste-editable.
SPSS 26 - The Analyze Catalog
Another new feature is the Analyze Catalog shown below. It's accessible from the Data View tab.
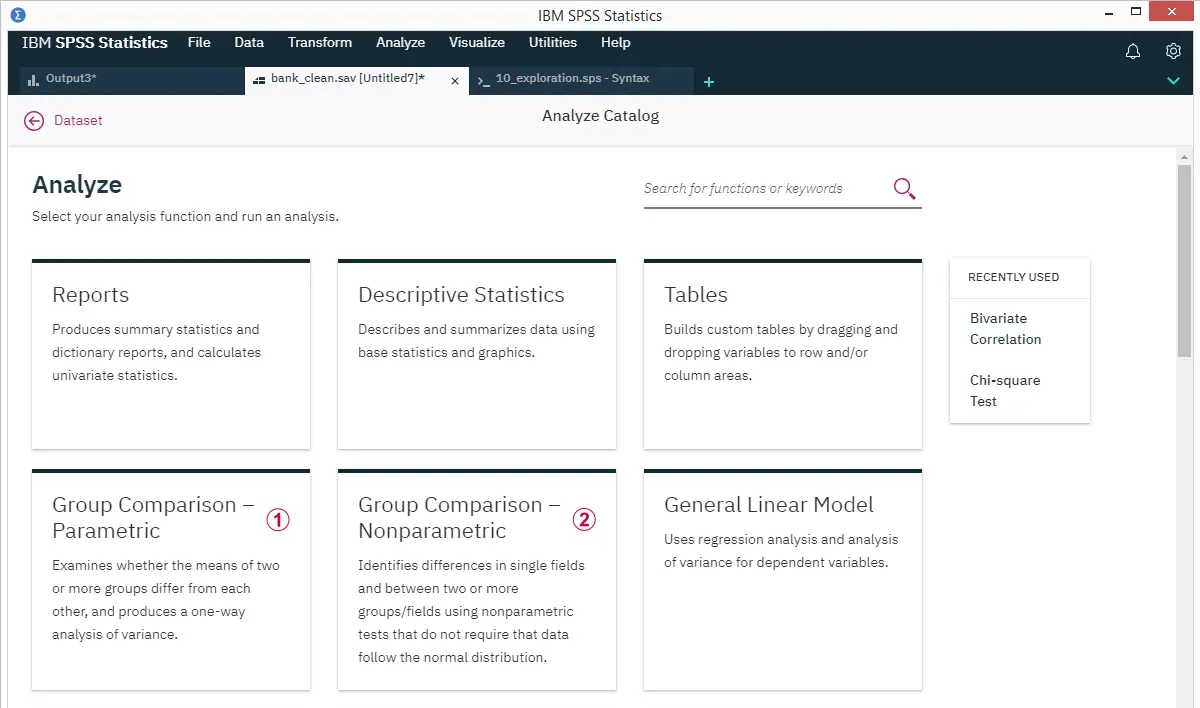
Sadly, the information here is incomplete and inaccurate.
For example, Group Comparison - Parametric doesn't mention any t-tests. Also, the one sample t-test and paired samples t-test don't compare “two or more groups”. The old description -“Compare Means”- did apply to all these tests.
Group Comparison - Nonparametric suggests that parametric tests require that “data follow the normal distribution”. This is wrong: the normality assumption is rarely required for reasonable sample sizes. This is why the Kolmogorov-Smirnov test is usually useless.
The way I see it is that
- SPSS users who don't know what to do need educational material optimized for educational purposes and
- SPSS users who know what to do need software optimized for production purposes.
A product that tries to combine these conflicting purposes will suck at both. This point could hardly be illustrated more convincingly than by the analyze catalog.
Anyway. One thing I do like about the analyze catalog is the search function. So I don't immediately see ANOVA anywhere in the menu but searching for it will surely get me there right away. Right? Well, let's take a look at the search results below.
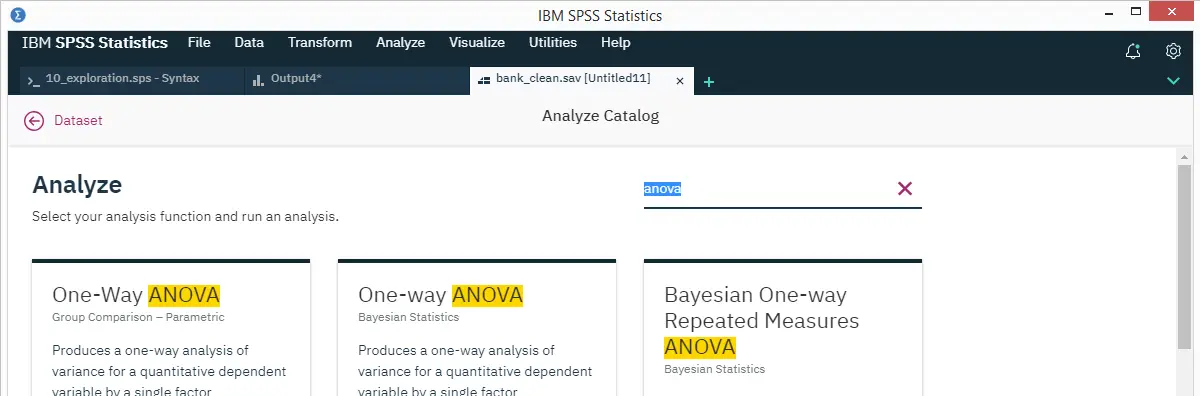
The search results lead me to the Oneway dialog but not GLM or MEANS. The problem here is that
- Oneway does not include partial eta squared, an effect size measure for ANOVA. We need to run our ANOVA from MEANS or GLM in order to get it;
- MEANS, however, does not offer Levene's test for homogeneity. We need either Oneway or GLM for that;
- If homogeneity doesn't hold, we may want to interpret the Welch statistic, only available in Oneway.
The real problem here is that a complete ANOVA can't be run from any single dialog or command in SPSS. Instead, we need to run a single analysis multiple times from different commands if we need all relevant output. And our search results don't even mention MEANS or GLM.
Ok, then let's search for a simpler analysis: the Kruskall-Wallis test.
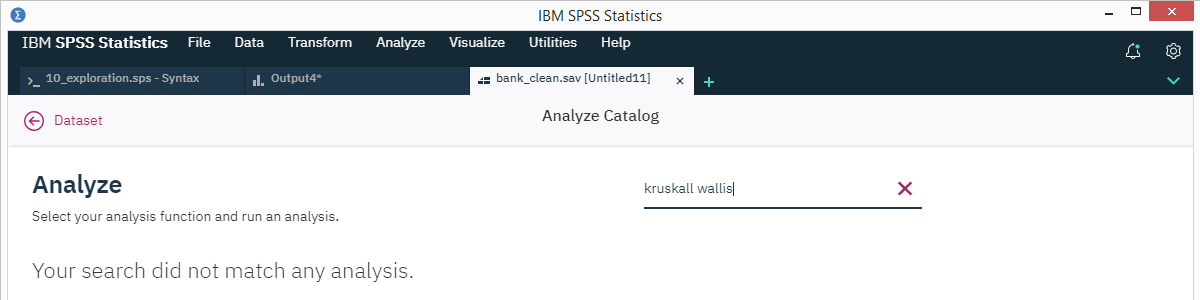
My search doesn't come up with anything at all. This is because I tested for a common misspelling of “Kruskal-Wallis test”. And the search function seems completely unable to handle it.
SPSS 26 - Conclusions
Summarizing this review, I think
SPSS’ new interface is worse than the old interface
in basically all regards:
- the visual layout -especially of the variable list and dialog tabs- is not as clear and simple as it used to be;
- essential functionality -such as pasting syntax and major analyses- are harder to find;
- most operations require more mouse clicks than they used to;
- many shortkeys no longer work -although a couple of new ones for navigating and closing tabs have been added.
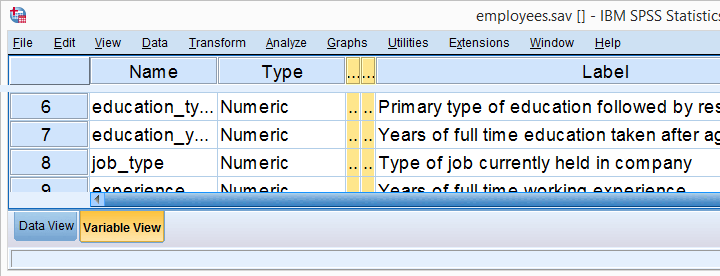 The nice and clear classic variable view
On top of that, the new interface is seriously incomplete. A handful of examples are that
- the View and Edit menus are missing;
- there's no Legacy Dialogs under Visualize;
- pivoting trays for rearranging pivot table dimensions aren't available;
- OMS information is unavailable from the output outline.
Some of those may be added to the new interface. But what about first finishing a product and then launching it?
In any case, I agree that SPSS urgently needs major improvements. This review hinted at a couple of those but there's tons more. Sadly, none of the things SPSS really needs was added to version 26. One thing SPSS did not really need, was a new interface.
If it ain't broken, don't fix it.
Thanks for reading.
SPSS – How to fix “Your license will expire in … days”?
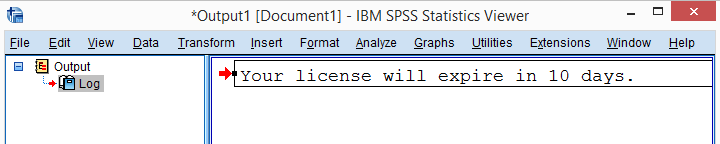
I'm a pretty happy SPSS user but since a while, the software has been telling me that
“Your license will expire in ... days.”
I had already extended my license with another year but -apparently- SPSS seemed to be oblivious to that. It took me some trial and error to troubleshoot the issue. Since I'm running this website anyway, I thought I may just as well share my solution.
Note: before you start, close SPSS entirely.
Step 1 - Find your Authorization Code
After extending my license, I received a bunch of emails from IBM and one of them contained an authorization code denoted as “AuthCode” as shown below.
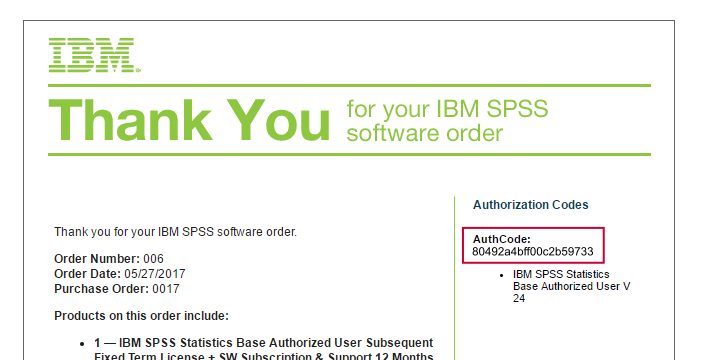
If you really can't find it, you can get one from the IBM website (if you're a licensed user of course). I should add that actually getting things done here may be a long and tedious process -in my experience at least.
Step 2 - Run law.exe
With your authorization code nearby, open up the SPSS installation folder. For recent versions it may be something like C:\Program Files\IBM\SPSS\Statistics\24 in this folder you'll find a tiny program called law.exe as shown below.
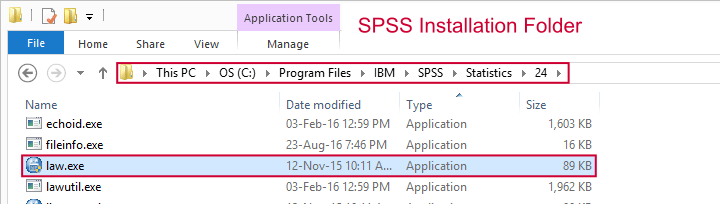
At first I thought this referred to something legal (“law” as in “breaking the law”). Then I learned that “law” is short for “License Authorization Wizard”. Let's run it, for instance by double clicking it.
Step 3 - Proceed through License Authorization Wizard
Most of the following steps are rather straightforward as shown below.
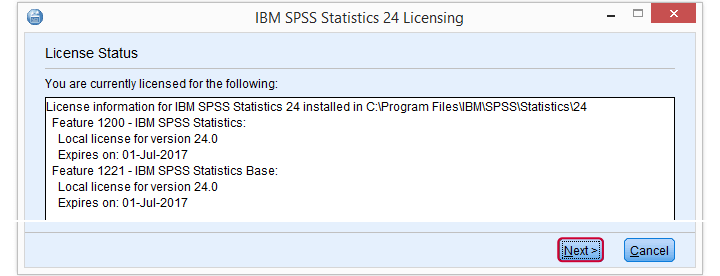
I must confess that I found the next step (below) somewhat confusing. However, I just entered the authorization code here, clicked and proceeded.
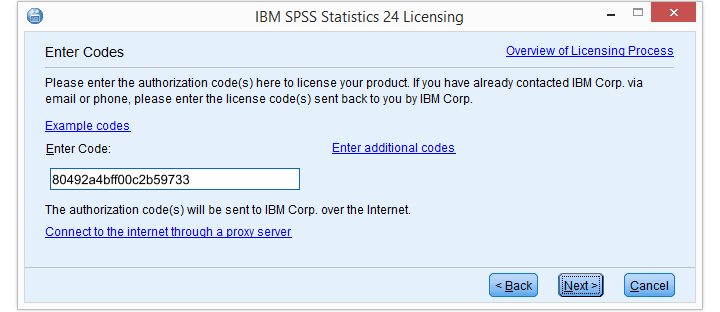
Well, that did the job for me. In order to really make sure everything's ok, I'll propose a quick final check below.
Step 4 - Check
At this point, you can start SPSS and open a new syntax editor window. Copy-paste
show license.
into it and run it. The resulting table in the output viewer window should now confirm that you're good to go.
Thanks for reading!