Measurement levels refer to different types of variables
that imply how to analyze them.
Standard textbooks distinguish 4 such measurement levels or variable types. From low to high, these are
- nominal variables;
- ordinal variables;
- interval variables;
- ratio variables.
The “higher” the measurement level, the more information a variable holds. The simple flowchart below shows how to classify a variable.
Measurement Levels - Classical Approach
 Quick Overview of Measurement Levels
Let's now take a closer look at what these variable types really mean with some examples.
Nominal Variables
A nominal variable is a variable whose
values don't have an undisputable order.
So let's say we asked respondents in which country they live and the answers are
- the Netherlands;
- Belgium;
- France;
- Germany;
- Luxembourg.
So what's the correct order for these countries? Well, we could sort them alphabetically, according to their sizes or to numbers of inhabitants. Different orders make sense for a list of countries. In short,
countries don't have an undisputable order
and therefore “country” is a nominal variable.
Now, countries may be represented by numbers (1 = Netherlands, 2 = Belgium and so on) in SPSS or some other data format. These numbers do have an undisputable order. But country is still a nominal variable because what's represented by these numbers -countries- does not have an undisputable order.
 Country -even if represented as numbers- is still a nominal variable
In a similar vein, ZIP codes -representing geographical areas which don't have a clear order- are nominal as well. But prices in dollars -representing amounts of money- obviously do have an undisputable order and hence are not nominal.
Ordinal Variables
Ordinal variables hold values that have an undisputable order
but no fixed unit of measurement.
Some fixed units of measurement are meters, people, dollars or seconds. However, there's no fixed unit of measurement for a question like
“how did you like your food?”
with the following answer categories:
- Bad;
- Neutral;
- Good.
Some may argue that Bad = 1 point, Neutral = 2 points and Good = 3 points. But that's just a wild guess. Perhaps our respondents feel Neutral represents 1.5 or 2.5 points. This is illustrated by the figure below.
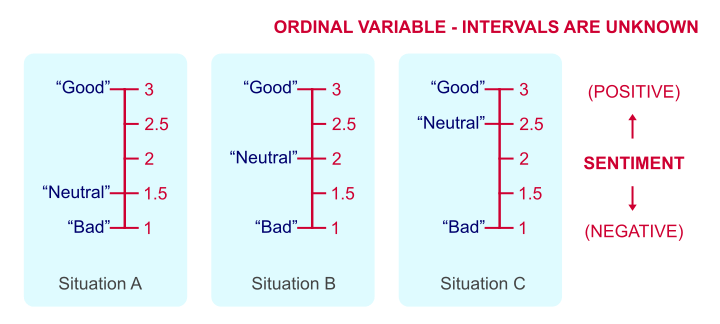 Intervals between answer categories are unknown for ordinal variables.
We've no way to prove which scenario is true because just “points” are not a fixed unit of measurement. And since we don't know if Neutral represents 1.5, 2 or 2.5 points, calculations on ordinal variables are not meaningful. Less strictly though, calculations on ordinal variables are quite common under the Assumption of Equal Intervals.
Also note that monthly income measured as
- Less than € 1000,-;
- € 1000,- to € 2000,-;
- € 2000,- or over.
is ordinal. Euros are a fixed unit of measurement but the answers are income categories, not numbers of Euros.
Interval Variables
Interval variables have a fixed unit of measurement
but zero does not mean “nothing”.
One of the rare examples is “in which year did it happen?”
Ignoring leap days, years are a fixed unit of measurement for time. However, the year zero doesn't mean “nothing” with regard to time.
As a consequence,
multiplication is not meaningful for interval variables.
The year 2000 isn't “twice as late” as the year 1000. The same goes for temperature in degrees Celsius: zero degrees is not “nothing” with regard to temperature. Therefore, 100 degrees is not twice as hot as 50 degrees. This argument could, however, be made for temperature in Kelvin.
We should add that these are the only 2 examples of interval variables we could think of. Interval variables are always analyzed similarly to ratio variables -which we'll turn to next. But distinguishing these as separate measurement levels -all textbooks still do- is pointless.
Ratio Variables
Ratio variables have a fixed unit of measurement
and zero really means “nothing.”
An example is weight in kilos. A kilo is a fixed unit of measurement because it always represents the exact same weight. Also, zero kilos corresponds to “nothing” with regard to weight. As a consequence,
multiplication is meaningful for ratio variables.
In fact, we don't need more than a kitchen scale to prove that 2 times 1 kilo really is the same amount of weight as 1 time 2 kilos.
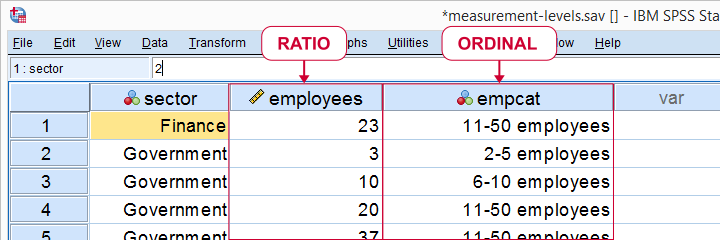 Number of employees as ratio as well as ordinal variable
Some text books mention an “absolute zero point”. We rather avoid this phrasing because ratio variables may hold negative values; the balance of my bank account may be negative but it has a fixed unit of measurement -Euros in my case- and zero means “nothing”.
Classical Measurement Levels - Shortcomings
We argued that measurement levels matter because they facilitate data analysis. However, when we look at common statistical techniques, we see that
- dichotomous variables are treated differently from all other variables but classical measurement levels fail to distinguish them;
- metric variables (interval and ratio) are always treated identically;
- categorical variables (nominal and ordinal) are sometimes treated similarly and sometimes not.
Because of these reasons, we think the classification below is much more helpful.
Measurement Levels - Modern Approach
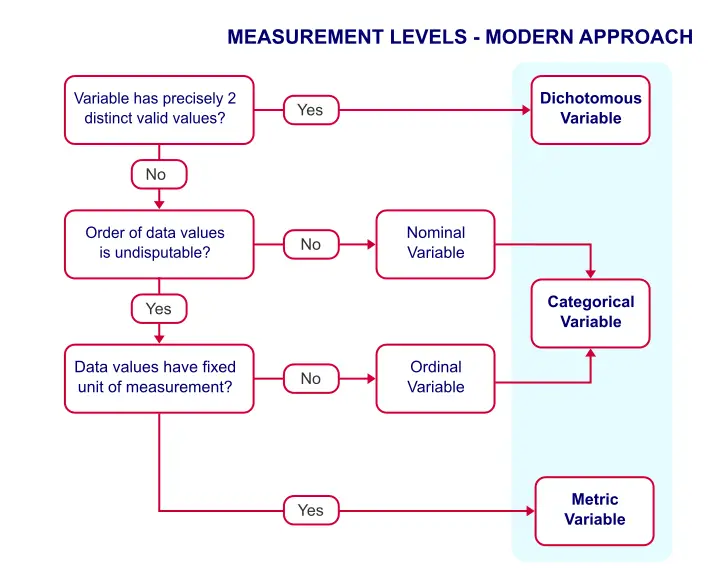
This classification distinguishes 3 main categories which we'll briefly discuss.
Dichotomous Variables
Dichotomous variables have precisely two distinct values. Typical examples are sex, owning a car or carrying HIV. It is useful to distinguish dichotomous variables as a separate measurement level because they require different analyses than other variables:
- an independent samples t-test tests if a dichotomous variable is associated with a metric variable;
- a z-test and Phi-coefficient are used to test if 2 dichotomous variables are associated;
- logistic regression predicts a dichotomous outcome variable.
Categorical Variables
Categorical variables are variables on which
calculations are not meaningful.
Therefore, nominal and ordinal variables are categorical variables. They contain (usually few) answer categories. Because calculations are not meaningful, categorical variables merely define groups. We therefore analyze them with frequency distributions and bar charts.
Metric Variables
Metric variables are variables on which
calculations are meaningful.
That is: interval and ratio variables are metric variables. Because calculations are allowed, we typically analyze them with descriptive statistics such as
- means;
- standard deviations;
- skewnesses.
Data Analysis - Next Steps
We just argued that
- categorical variables define groups of cases and
- we use descriptive statistics for analyzing metric variables.
Now, say we'd like to know if 2 categorical variables are associated. Then the first variable defines groups and the second variable defines groups within those groups. A table that shows just that is a contingency table as shown below. It basically holds frequency distributions within frequency distributions
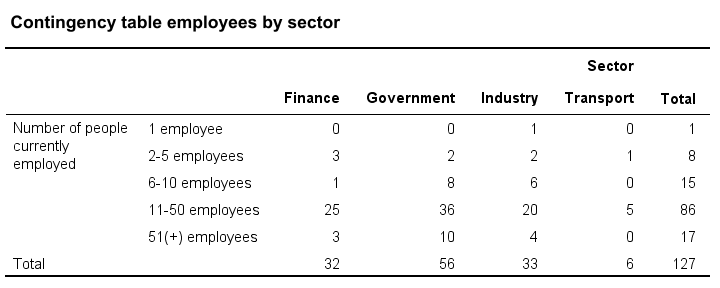
Next, we could visualize the association with a stacked bar chart. Or we may test if the association is statistically significant by running a chi-square independence test on our contingency table.
Or perhaps we'd like to know if a categorical variable and a metric variable are associated. The categorical variable defines groups. Within those groups, we'll inspect descriptive statistics over our metric variable. We thus arrive at the table as shown below.
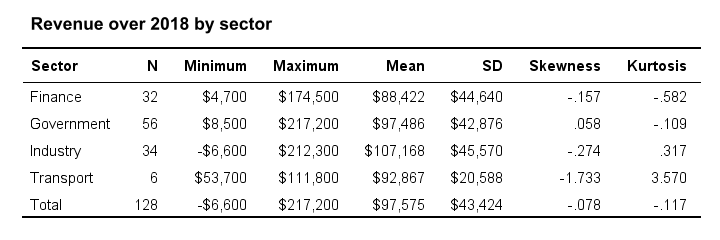
We could visualize the means as a bar chart for means by category. Or we could test if the population means differ by category with ANOVA.
So now we see how measurement levels help us choose the right analyses. For a more complete overview of analyses by measurement level, see SPSS Data Analysis - Basic Roadmap.
Thanks for reading!
THIS TUTORIAL HAS 38 COMMENTS:
By Locatelli Marilena on April 3rd, 2016
In a data set I found the following description of a variable:
" This variable is numeric, the SPSS measurement level is SCALE".
The variable is coded from 1 to 5.
I did'nt find "SCALE" in your tutorial
Could you, please, help me?
Best regards
Marilena Locatelli
By Ruben Geert van den Berg on April 4th, 2016
Hi Marilena!
"Scale" simply means "metric" in SPSS. I should have mentioned that in this tutorial.
Most SPSS commands completely ignore measurement levels. For instance, DESCRIPTIVES will run fine on nominal/ordinal variables, even if that's theoretically not appropriate.
However, some commands such as CTABLES and GGRAPH do use measurement levels in order to guide you towards theoretically appropriate tables and charts for the variables you include. In practice, you'll sometimes want to ignore what SPSS thinks is best for you.
Hope that helps!
By Roberts Rios on June 19th, 2016
Thank you for the tutorial.
I have a small question though. I have a set of DV which I would consider an interval that goes between -1 to 1 (Being -1 the lowest score and +1 the highest; 0 being 50% score). Would this be consider a scale variable in SPSS? Should I need to recode it?
By Ruben Geert van den Berg on June 20th, 2016
Hi Roberts! There's no way of telling the measurement level of your variable without knowing what -1 and +1 actually mean.
If they mean "Bad" and "Good", then you'd probably consider it ordinal since there isn't any fixed unit of measurement for such sentiments. However, if these are temperatures in degrees Celsius -a fixed unit of measurement- in your fridge, then you'd consider it a metric ("scale" in SPSS) variable.
By Torikul on July 12th, 2016
thanks man