- Median - Simple Data Examples
- Relation Median and Mean
- Median - Strengths & Weaknesses
- Finding Medians in SPSS
- Statistical Significance for Medians - Sign Tests
The median is the middle value after sorting all values for an odd number of values. For an even number of values, it's the average of the 2 middle values after sorting all values. The examples below from this Googlesheet (read only) will make this perfectly clear.
Median - Simple Data Examples
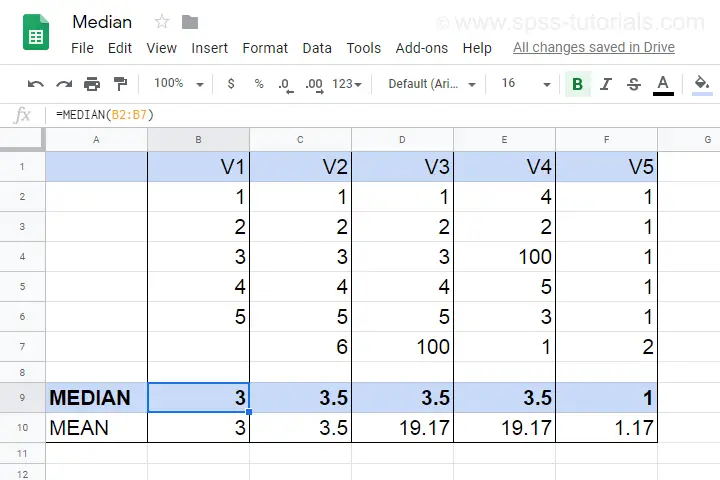
- V1 holds values 1 through 5 sorted ascendingly. The median -middle value- is 3.
- V2 holds values 1 through 6 sorted ascendingly. The median is 3.5. It is the average of the 2 middle values 3 and 4.
- V3 is V2 with 6 replaced by 100. This greatly affects the mean but the 2 middle values -and hence the median- stay the same.
- V4 holds the values of V3 in random order. The median is not the average of the 2 middle values unless we first sort them.
- V5 contains ties: the value 1 occurs 5 times. Since the values are sorted, the median is the average of the 2 middle values (1 and 1).
Note that for V2 through V4,
the median is the value that separates
the 50% highest values from the 50% lowest values.
This turns out to hold for most (semi)continuous variables that we find in real-world data such as
- exact monthly incomes in dollars,
- body weight in grams or
- age in days.
However, it may not hold at all for heavily tied data (such as V5) or small numbers of observations.
Relation Median and Mean
We'll discuss the pros and cons of medians versus means in a minute. Let's first see how they relate in the first place. This depends mostly on the skewness of the frequency distribution of some variable:
the median is equal to the mean
for symmetrically distributed variables
which implies skewness = 0. The histogram shown below illustrates this point.
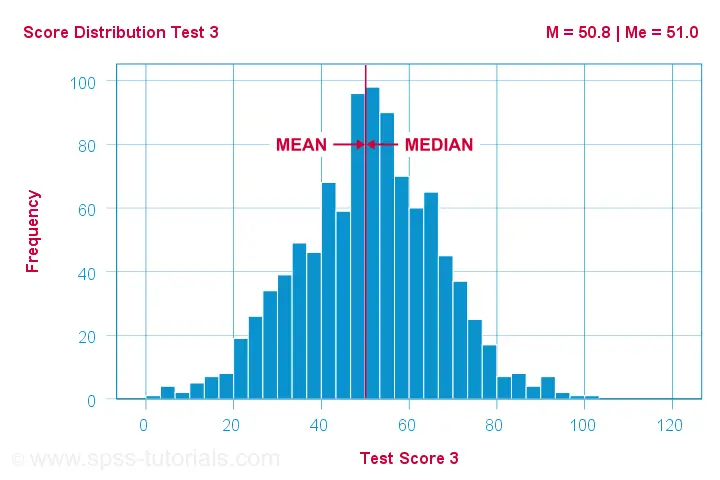
Skewness is basically zero for these 1,000 test scores. The sample mean (M) = 50.8 while the median (Me) = 51.0. The red lines indicating them on the x-axis are indistinguishable.
Different patterns occur when skewness is substantial. First off,
the median is smaller than the mean
for positively skewed variables
as shown below.
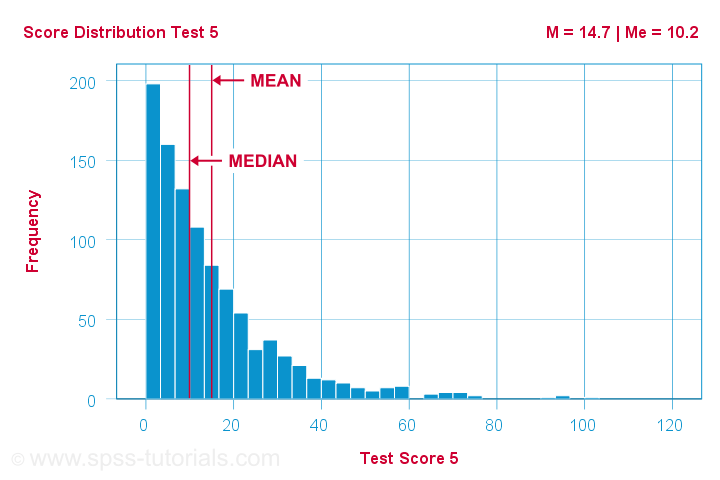
What basically happens here is that some very high scores affect the mean but not the median. We already saw this in our initial examples: changing {1,2,3,4,5,6} to {1,2,3,4,5,100} greatly affects the mean but the median is 3.5 for both variables. The histogram above shows the exact same phenomenon but it uses more realistic data.
As you can probably guess by now, the opposite also holds:
the median is larger than the mean
for negatively skewed variables
as illustrated by the histogram below.
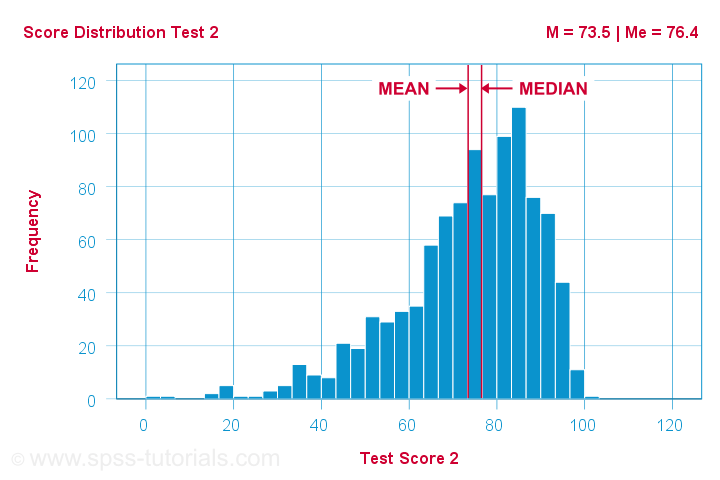
What basically happens here is that the very low scores “drag down” the mean. The median, however, is unaffected by these.
Median - Strengths & Weaknesses
Thus far, this introduction implicitly pointed out some strengths of the median compared to the mean:
- The median is not sensitive to outliers. So perhaps the mean salary for some people is high due to a single billionaire. I'd rather know the median salary in this case. This'll tell me (roughly) which salary separates the 50% lowest from the 50% highest incomes. It's a more realistic estimate of what these people tend to earn.
- Means are applicable only to quantitative variables. Medians are also suitable for ordinal variables. However, ordinal variables typically have tons of ties (values that occur more than once). For such variables, medians may be misleading as shown below.
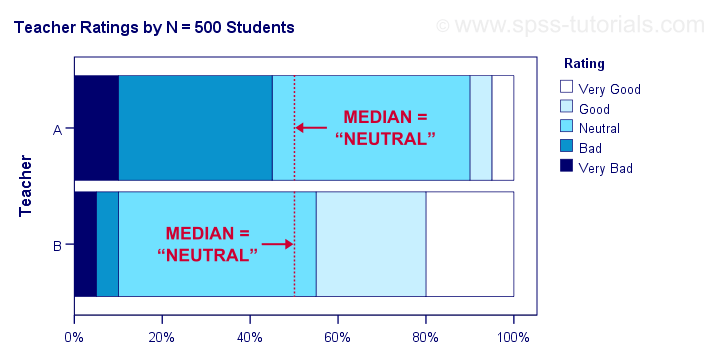
Although teacher B is rated much more favorably than teacher A, their median ratings are identical.
Apart from these strengths, medians have some weaknesses too:
- Medians are unsuitable for numeric calculations. For instance, sums can be calculated from means and sample sizes but not from medians. The difference between 2 means is easily interpretable but the difference between 2 medians hardly so.
- In the presence of ties, very different variables may have similar medians.
- The median may not actually exist. For instance, if two people have 0 and 1 children, their median is 0.5 children.
- The median is said to fluctuate more from sample to sample than the mean. That is, it is less stable and has a larger standard error.
Finding Medians in Googlesheets
Finding medians is super easy with Googlesheets. For example, typing =MEDIAN(B2:B7) into any cell results in the median of cells B2 through B7 (assuming all non empty cells contain numbers). Some more examples are shown in this Googlesheet (read only).
Finding Medians in SPSS
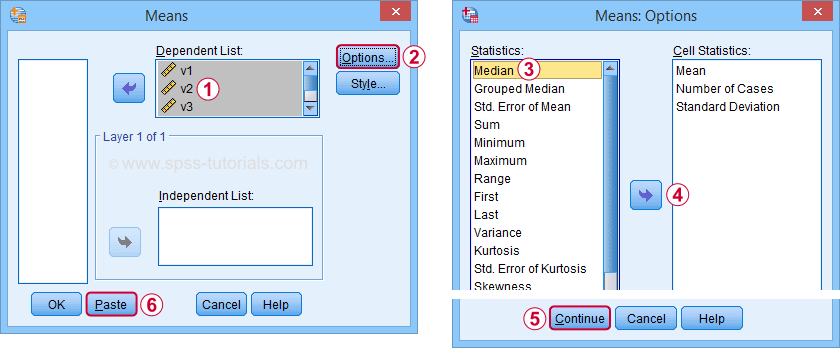
In SPSS, the best option to find medians is from
![]()
![]() Use this dialog to create a table showing a wide variety of descriptive statistics including the mean, standard deviation, skewness, kurtosis and more. Optionally, these are reported for separate groups defined by “Independent List”.
Use this dialog to create a table showing a wide variety of descriptive statistics including the mean, standard deviation, skewness, kurtosis and more. Optionally, these are reported for separate groups defined by “Independent List”.
An even faster option is typing and running the resulting syntax -a simple MEANS command- such as
means v1 to v5
/cells count mean median.
An example of the resulting table -after some adjustments- is shown below.
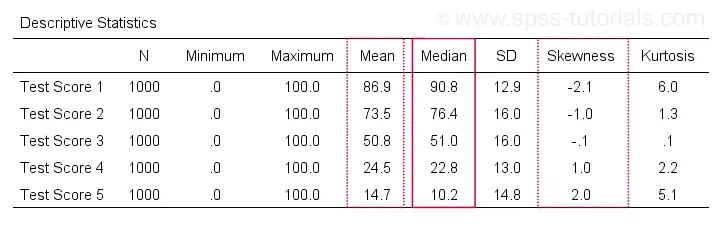
Notice the huge positive correlation between skewness and (mean - median): the median is larger than the mean insofar as a variable is more negatively (left) skewed. The opposite pattern -mean larger than median- occurs for positively (right) skewed variables. This was previously illustrated with some histograms based on the same data file as this table.
Statistical Significance for Medians - Sign Tests
Among the most popular statistical techniques are t-tests. These test if the difference between 2 means is statistically significant. But what if we want to test for medians instead of means? In this case we'll end up with one of 3 median tests, sometimes called sign tests:
- A sign test for 1 median is similar to a one sample t-test for a median: it compares the sample median to a hypothesized value.
- The sign test for independent medians is similar to an independent samples t-test or a one-way ANOVA for medians: it tests if 2 or more populations have equal medians.
- A sign test for related medians is similar to a paired samples t-test for medians: it tests if 2 variables measured on the same people or other observations have equal medians.
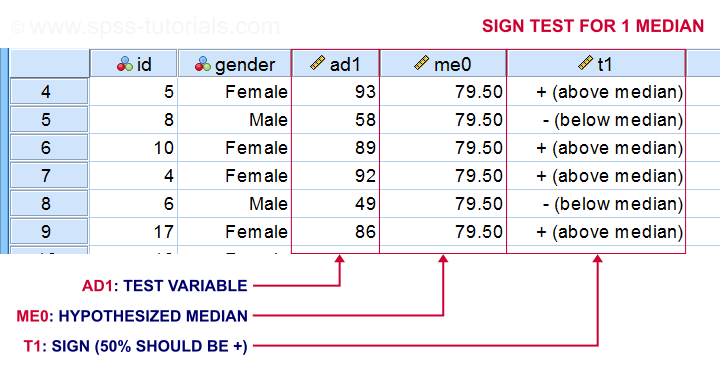
A sign test for 1 median basically works like this:
- each value smaller than the hypothesized median is replaced by a minus (-) sign;
- values larger than the hypothesized median are replaced by plus (+) signs;
- if the hypothesized median is correct, then some 50% of all signs should be plusses;
- a binomial test examines if the sample proportion of plusses is significantly different from 0.5.
The other sign tests follow the same basic reasoning. Sign tests are not very popular because ties are problematic for them and they tend to have low statistical power.
Thanks for reading!
THIS TUTORIAL HAS 14 COMMENTS:
By Jon K Peck on October 14th, 2019
Medians in SPSS: FREQUENCIES, EXAMINE, SUMMARIZE, CTABLES, and probably other places. Note also that quantile regression (QUANTILE REGRESSION or SPSSINC QUANTREG) allow you to estimate models of the median.
Also, while the median might not exist in the data, this is also true of the mean.
By Ruben Geert van den Berg on October 15th, 2019
Hi Jon, thanks for your comment!
I know there's several options for medians but my favorite is MEANS because of the nice and simple table format. I think that's hard to beat. I don't see any huge advantages of the other commands. Still funny that the most likely option -DESCRIPTIVES- does not provide medians.
By Jon K Peck on October 15th, 2019
One advantage of using EXAMINE in the context of the median is that it also provides a number of other robust statistics and plots. The median is just one estimate of central tendency, and M estimators, outlier detection etc gives a fuller picture. Nothing wrong with MEANS, in fact, MEANS and SUMMARIZE are mostly the same procedure.
It is kind of silly that DESCRIPTIVES does not include the median, but this is probably an historical artifact of the computational requirements for calculating the median. Overall, I would choose EXAMINE in place of DESCRIPTIVES, anyway.
By Ruben Geert van den Berg on October 16th, 2019
I always recommend inspecting histograms for detecting outliers or unusual distributions. I think what's an outlier depends on the entire distribution: if a tail gradually flattens off, I'm willing to accept higher values as credible because they still reasonably fit the overall picture. And so on...
I think DESCRIPTIVES is great for finding the listwise valid N -even for nominal variables whose means/SDs are meaningless. Other than that, I always go for MEANS. Combined with 2 routine OUTPUT MODIFY commands it gives me pretty perfect tables.
I particularly don't like the extra table dimension (statistic / SE) when requesting skewness/kurtosis. In fact, the SE doesn't even make sense for population data -but SPSS does a poor job on that anyway unless you're willing to use the complex samples module.
By Mariam on November 5th, 2019
Kindly email the pdf of the tutorial if possible