- 1. Set Up Matrix Data File
- 2. SPSS Oneway Dialogs
- 3. Adjusting the Syntax
- 4. Interpreting the Output
In SPSS, you can fairly easily run an ANOVA or t-test without having any raw data. All you need for doing so are
- the sample sizes,
- the means and
- the standard deviations
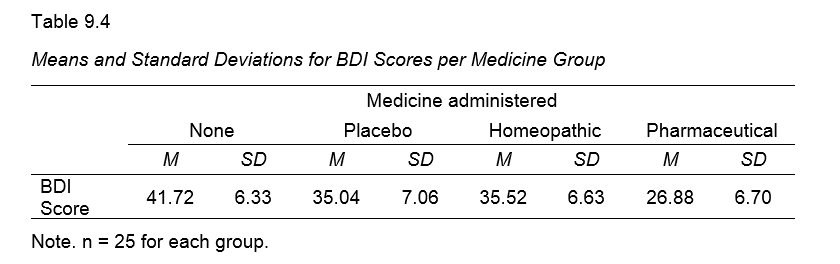
of the dependent variable(s) for the groups you want to compare. This tutorial walks you through analyzing the journal table shown below.
1. Set Up Matrix Data File
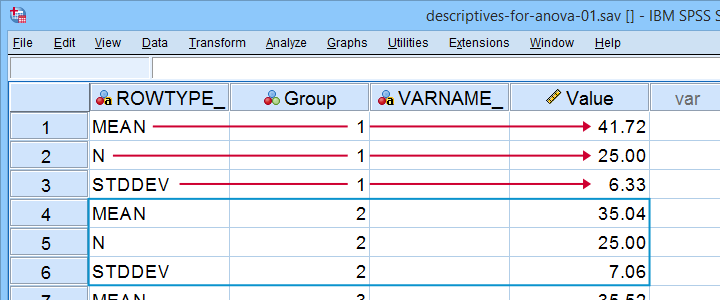
First off, we create an SPSS data file containing 3 rows for each group. You may use descriptives-for-anova-01.sav -partly shown below- as a starting point.
There's 3 adjustments you'll typically want to apply to this example data file:
- removing or adding sets of 3 rows if you want to compare fewer or more groups;
- changing sample sizes, means and standard deviations in the “Value” variable;
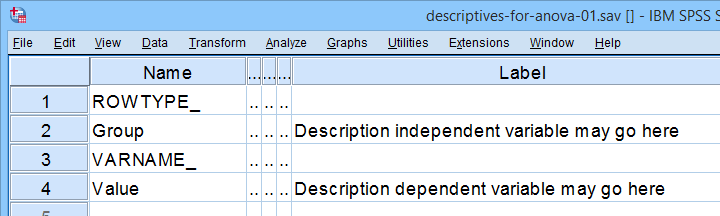
- changing the variable labels for the independent and dependent variables as indicated below.
I recommend you don't make any other changes to this data file or otherwise the final analysis is likely to crash. For instance,
- don't change any variable names;
- don't change the variable order;
- don't remove the empty string variable VARNAME_
2. SPSS Oneway Dialogs
First off, make sure the example data file is the only open data file in SPSS. Next, navigate to
![]()
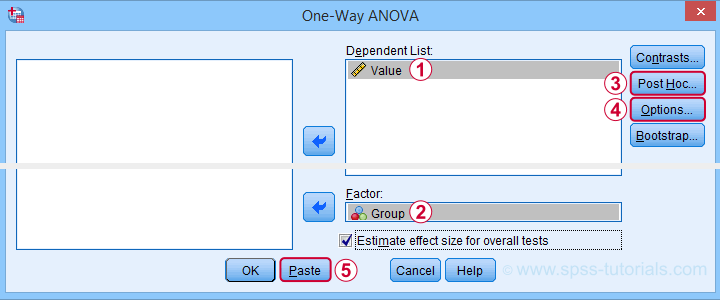
![]() and fill out the dialogs as if you're analyzing a “normal” data file.
and fill out the dialogs as if you're analyzing a “normal” data file.
 You may select all options in this dialog. However, Levene's test -denoted as Homogeneity of variances test- will not run as it requires raw data.
This is no problem for the data at hand due to their equal sample sizes. For other data, it may be wise to carefully inspect the Welch test as discussed in SPSS ANOVA - Levene’s Test “Significant”.
Anyway, completing these steps results in the syntax below. But don't run it just yet.
ONEWAY Value BY Group
/ES=OVERALL
/STATISTICS DESCRIPTIVES WELCH
/PLOT MEANS
/MISSING ANALYSIS
/CRITERIA=CILEVEL(0.95)
/POSTHOC=TUKEY ALPHA(0.05).
3. Adjusting the Syntax
Note that we created syntax just like we'd do when analyzing raw data. You could run it, but SPSS would misinterpret the data as 4 groups of 3 observations each. For SPSS to interpret our matrix data correclty, add /MATRIX IN(*). as shown below.
ONEWAY Value BY Group
/ES=OVERALL
/STATISTICS DESCRIPTIVES WELCH
/PLOT MEANS
/CRITERIA=CILEVEL(0.95)
/POSTHOC=TUKEY ALPHA(0.05)
/matrix in(*).
*CORRECTED SYNTAX FOR SPSS 26 OR LOWER.
ONEWAY Value BY Group
/STATISTICS DESCRIPTIVES WELCH
/PLOT MEANS
/CRITERIA=CILEVEL(0.95)
/POSTHOC=TUKEY ALPHA(0.05)
/matrix in(*).
4. Interpreting the Output
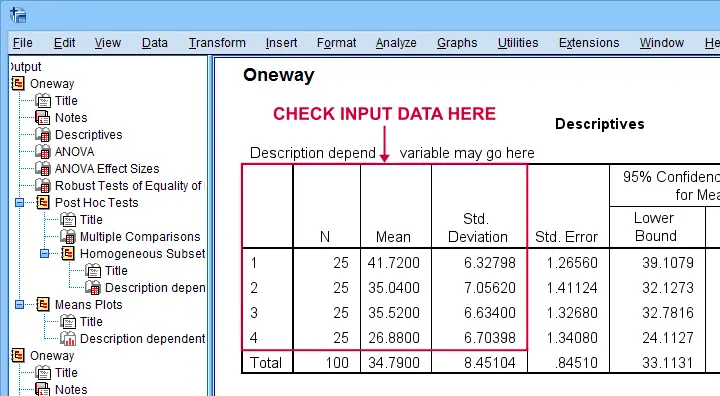
First off, note that SPSS has understood that our data file has 4 groups of 25 observations each as shown below.
The remainder of the output is nicely detailed and includes
- the main ANOVA F-test;
- post-hoc tests (Tukey's HSD);
- the Welch test (not really needed for this example);
- a line chart visualizing our sample means;
- various effect size measures such as partial eta squared (only SPSS version 27+).
The main output you cannot obtain from these data are
- Levene's test for the homogeneity assumption;
- the Kolmogorov-Smirnov normality test and;
- the Shapiro-Wilk normality test.
For the sample sizes at hand, however, none of these are very useful anyway. A more thorough interpretation of the output for this analysis is presented in SPSS - One Way ANOVA with Post Hoc Tests Example.
Right, so I hope you found this tutorial helpful. We always appreciate if you throw us a quick comment below. Other that that:
Thanks for reading!
THIS TUTORIAL HAS 11 COMMENTS:
By Jon K Peck on October 1st, 2022
Dealing with pre-aggregated data is a common issue.
The ONEWAY example shows how to deal with that with any number of groups, but I want to mention the SPSSINC SUMMARY TTEST extension command. It does the two-sample t test, including confidence intervals without the need to create a dataset.
The parameters are just entered in the syntax (or via the dialog box). E.g.,
SPSSINC SUMMARY TTEST N1=25 MEAN1=5 SD1=1 LABEL1="Sample 1" N2=20 MEAN2=6 SD2=2 LABEL2="Sample 2" CI=95.
The dialog appears under Compare Means and Proportions > Summary Independent Samples TTest. (Compare Means and Proportions is the new name for what used to be Compare Means).
For crosstabs, weighting can be used to do tables based on aggregate data.
By Ruben Geert van den Berg on October 2nd, 2022
Hi Jon!
I already used SPSSINC SUMMARY TTEST in a couple of projects and covering it in a tutorial is on my agenda.
A tiny issue, though, is that it did not report any effect size measures. This surprised me as I'd think these would be very easy to add.
Has this been fixed yet? I'd really like to see both Cohen’s D and eta-squared.
I think the latter is actually more appropriate because this t-test is a special case of ANOVA so why use a completely different measure for 2 instead of 3+ groups?
Last question: could you make an educated guess which SPSS versions have this extension preinstalled?
By Jon Peck on October 3rd, 2022
I wrote this extension before effect size measures were widely available in Statistics (or, SPSS, when I wrote this). Adding effect size measures would be easy. Actually, I published a little Python script to add Cohen's d to the TTEST procedure output in the SPSS Statistics for Data Analysis and Visualization book. But I'll update the procedure soon.
It used to be the case that most of the extensions were automatically installed, which was a pretty heavy load on the menus for the users, but then some product manager decided not to preinstall any of them, and then a later product manager decided they should preinstall most of the Python ones but not the R ones, and I just heard that they are going to prune a few and then add a few others that are not currently preinstalled. All these changes happened after I retired, so I didn't hear much about the reasoning.
But now - as of V28, I think - both Python and R are preinstalled with Statistics, so it is very easy for a user to just go to the Extension Hub and get what they want if it isn't already installed. If an extension needs extra modules from CRAN or PyPi, those are also installed with the extension itself, but the STATS PACKAGE INSTALL also makes it easy for users to install Pyhthon or R modules independently of that. And, since extensions can be updated between releases, there will sometimes be updates available from the Hub anyway. Adding the effect measures will generate an update there, but users will have to go get it even with the current version installed.
The installation procedure for Statistics changed with V29 and, partially I think, in V28, so the Python and R code runs in a virtual environment that eliminates the permission problems and OS conflicts that sometimes occurred in the past.
By Ruben Geert van den Berg on October 3rd, 2022
Hi Jon!
I added your feedback as a comment to my post since it may be instructive to a more general audience.
Do I understand correctly that you're going to add effect size measures to the summary t-test extension? If so, could you drop me a quick line when it's available?
I'll happily write a couple of notes on updating to this new version via the extension hub as well (my tutorial on extensions is heavily outdated anyway).
Nice!!
By Jon K Peck on October 3rd, 2022
I have a few things ahead of this on my plate, but I'll let you know when it is updated.