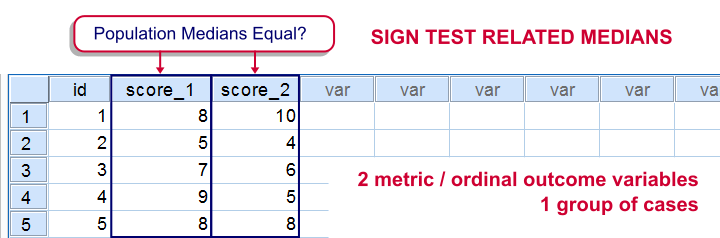
The sign test for two medians evaluates if 2 variables measured on 1 group of cases are likely to have equal population medians.There's also a sign test for comparing one median to a theoretical value. It's really very similar to the test we'll discuss here. Also see SPSS Sign Test for One Median - Simple Example . It can be used on either metric variables or ordinal variables. For comparing means rather than medians, the paired samples t-test and Wilcoxon signed-ranks test are better options.
Adratings Data
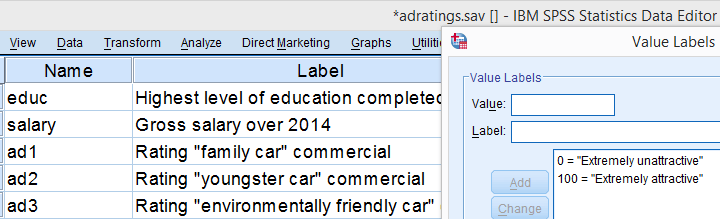
We'll use adratings.sav throughout this tutorial. It holds data on 18 respondents who rated 3 car commercials on attractiveness. Part of its dictionary is shown below.
Descriptive Statistics
Whenever you start working on data, always start with a quick data check and proceed only if your data look plausible. The adratings data look fine so we'll continue with some descriptive statistics. We'll use MEANS for inspecting the medians of our 3 rating variables by running the syntax below.DESCRIPTIVES may seem a more likely option here but -oddly- does not include medians - even though these are clearly “descriptive statistics”.
SPSS Syntax for Inspecting Medians
means ad1 to ad3
/cells count mean median.
SPSS Medians Output
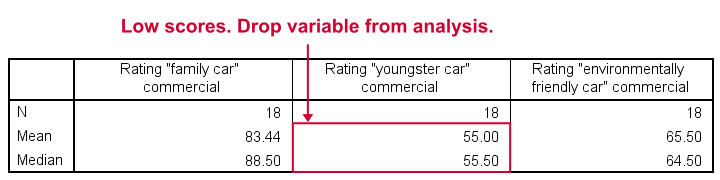
The mean and median ratings for the second commercial (“Youngster Car”) are very low. We'll therefore exclude this variable from further analysis and restrict our focus to the first and third commercials.
Sign Test - Null Hypothesis
For some reason, our marketing manager is only interested in comparing median ratings so our null hypothesis is that the two population medians are equal for our 2 rating variables. We'll examine this by creating a new variable holding signs:
- respondents who rated ad1 < ad3 receive a minus sign;
- respondents who rated ad1 > ad3 get a plus sign.
If our null hypothesis is true, then the plus and minus signs should be roughly distributed 50/50 in our sample. A very different distribution is unlikely under H0 and therefore argues that the population medians probably weren't equal after all.
Running the Sign Test in SPSS
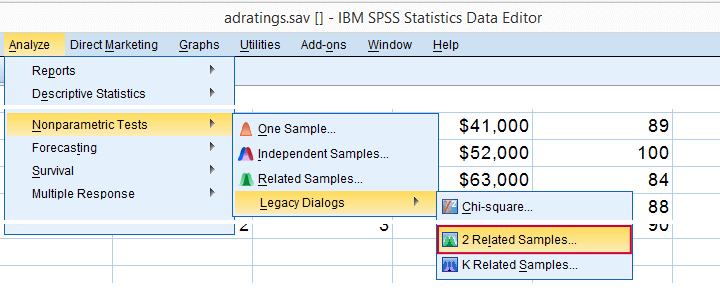
The most straightforward way for running the sign test is outlined by the screenshots below.
The samples refer to the two rating variables we're testing. They're related (rather than independent) because they've been measured on the same respondents.
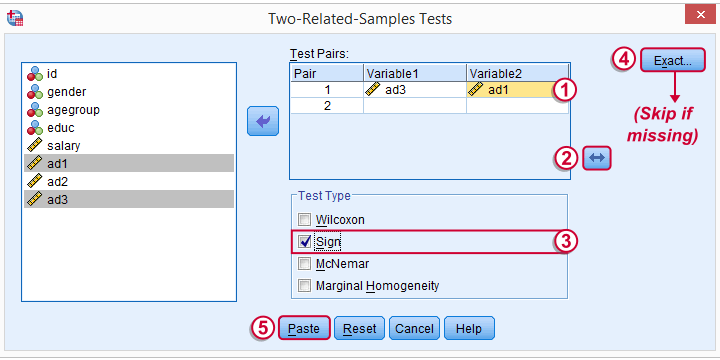
 We prefer having the best rated variable in the second slot. We'll do so by reversing the variable order.
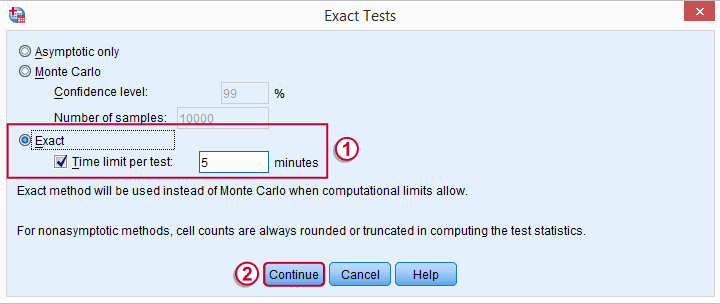
 Whether your menu includes the button depends on your SPSS license. If it's absent, just skip the step shown below.
SPSS Sign Test Syntax
Completing these steps results in the syntax below (you'll have one extra line if you included the exact test). Let's run it.
NPAR TESTS
/SIGN=ad3 WITH ad1 (PAIRED)
/MISSING ANALYSIS.
Output - Signs Table
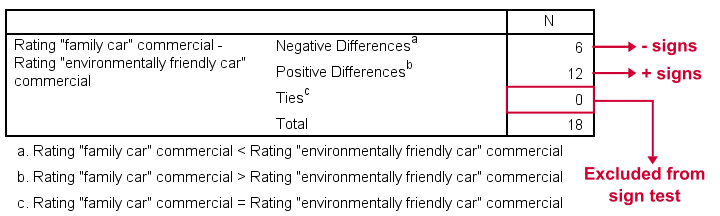
First off, ties (that is: respondents scoring equally on both variables) are excluded from this analysis altogether. This may be an issue with typical Likert scales. The percentage scales of our variables -fortunately- make this much less likely.
Since we've 18 respondents, our null hypothesis suggests that roughly 9 of them should rate ad1 higher than ad3. It turns out this holds for 12 instead of 9 cases. Can we reasonably expect this difference just by random sampling 18 cases from some large population?
Output - Test Statistics Table
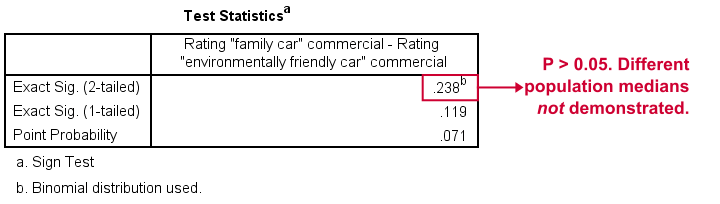
Exact Sig. (2-tailed) refers to our p-value of 0.24. This means there's a 24% chance of finding the observed difference if our null hypothesis is true. Our finding doesn't contradict our hypothesis is equal population medians.
In many cases the output will include “Asymp. Sig. (2-tailed)”, an approximate p-value based on the standard normal distribution.SPSS omits a continuity correction for calculating Z, which (slightly) biases p-values towards zero. It's not included now because our sample size n <= 25.
Reporting Our Sign Test Results
When reporting a sign test, include the entire table showing the signs and (possibly) ties. Although p-values can easily be calculated from it, we'll add something like “a sign test didn't show any difference between the two medians, exact binomial p (2-tailed) = 0.24.”
More on the P-Value
That's basically it. However, for those who are curious, we'll go into a little more detail now. First the p-value. Of our 18 cases, between 0 and 18 could have a plus (that is: rate ad1 higher than ad3). Our null hypothesis dictates that each case has a 0.5 probability of doing so, which is why the number of plusses follows the binomial sampling distribution shown below.
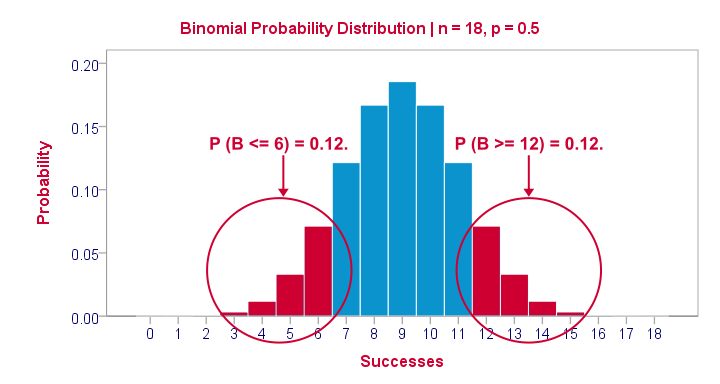
The most likely outcome is 9 plusses with a probability of roughly 0.175: if we'd draw 1,000 random samples instead of 1, we'd expect some 175 of those to result in 9 plusses. Roughly 12% of those samples should result in 6 or fewer plusses or 12 or more plusses. Reporting a 2-tailed p-value takes into account both tails (the areas in red) and thus results in p = 0.24 like we saw in the output.
SPSS Sign Test without a Sign Test
At this point you may see that the sign test is really equivalent to a binomial test on the variable holding our signs. This may come in handy if you want the exact p-value but only have the approximate p-value “Asymp. Sig. (2-tailed)” in your output. Our final syntax example shows how to get it done in 2 different ways.
Workaround for Exact P-Value
if(ad1 > ad3) sign = 1.
if(ad3 > ad1) sign = 0.
value labels sign 0 '- (minus)' 1 '+ (plus)'.
*Option 1: binomial test.
NPAR TESTS
/BINOMIAL (0.50)=sign
/MISSING ANALYSIS.
*Option 2: compute p manually.
frequencies sign.
*Compute p-value manually. It is twice the probability of flipping 6 or fewer heads when flipping a balanced coin 18 times.
compute pvalue = 2 * cdf.binom(6,18,0.5).
execute.