A z-test for a single proportion tests
if some population proportion is equal to x.
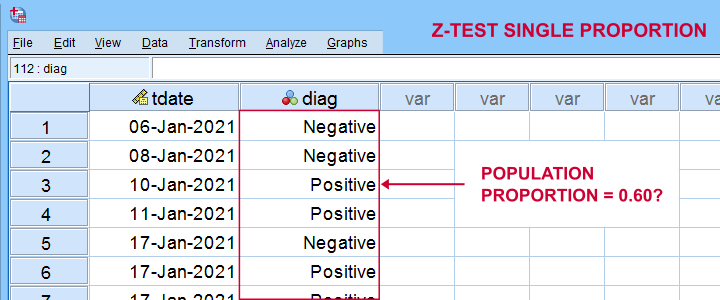
Example: does a proportion of 0.60 (or 60%) of all Dutch citizens test positive on Covid-19?
In order to find out, a scientist tested a simple random sample of N = 112 people. The results thus gathered are in covid-z-test.sav, partly shown below.
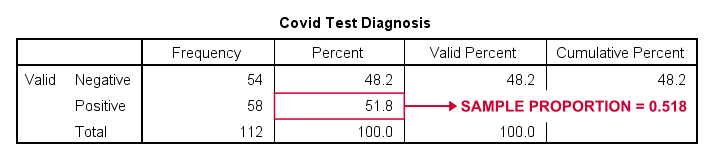
The first thing we'd like to know is: what's our sample proportion anyway? We'll quickly find out by running a single line of SPSS syntax: frequencies diag. The resulting table tells us that 51.8% (a proportion of .518) of our sample tested positive on Covid-19.
Now, does our sample outcome of 51.8% really contradict our null hypothesis that 60% of our entire population is infected? A z-test for a single proportion answers just that. However, it does require a couple of assumptions.
Z-Test - Assumptions
A z-test for a single proportion requires two assumptions:
- independent observations;
- \(n_1 \ge 15\) and \(n_2 \ge 15\): our sample should contain at least some 15 observations for either possible outcome.
Standard textbooks3,5 often propose \(n_1 \ge 5\) and \(n_2 \ge 5\) but recent studies suggest that these sample sizes are insufficient for accurate test results.2 For small sample sizes, the Agresti-Coull adjustment may somewhat improve your results.
A quick check for the sample sizes assumption is inspecting basic frequency distributions for the outcome variables. We already did this for our example data. Our outcomes -Covid negative or positive- have frequencies of 54 and 58 observations.
SPSS Z-Test Dialogs
Starting from SPSS version 27, z-tests are found under
![]()
![]() For our example study, we'll fill in the dialogs as shown below.
For our example study, we'll fill in the dialogs as shown below.
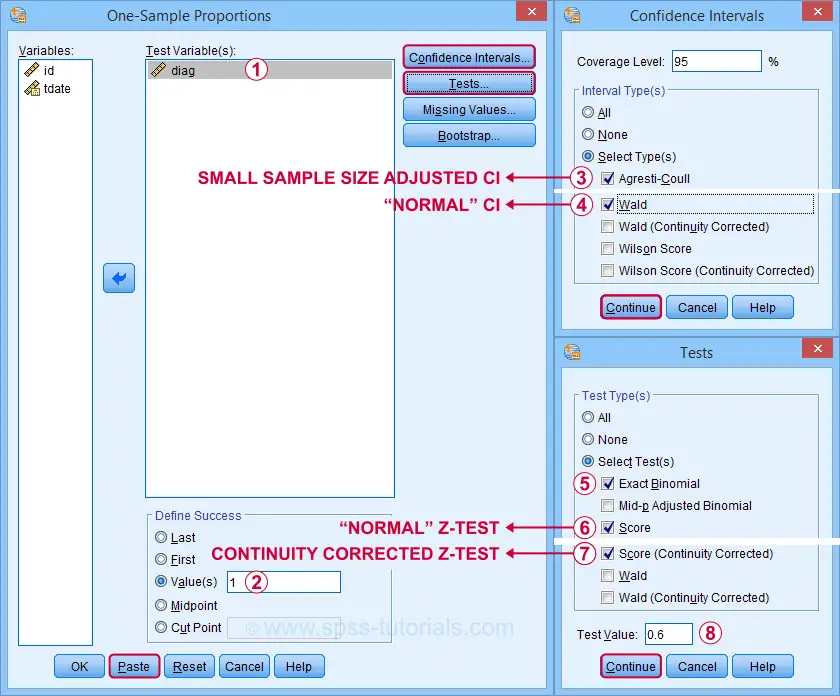
 Our hypothesis addresses the proportion of positive tests, which is coded as 1 in our data.
 Precisely, we hypothesized a population proportion of 0.60 (or 60%) to test positive for Covid-19.
Selecting these options results in the syntax below. Let's run it.
PROPORTIONS
/ONESAMPLE diag TESTVAL=0.6 TESTTYPES=EXACT SCORE SCORECC CITYPES=AGRESTI_COULL WALD
/SUCCESS VALUE=LEVEL(1 )
/CRITERIA CILEVEL=95
/MISSING SCOPE=ANALYSIS USERMISSING=EXCLUDE.
SPSS Z-Test Output
The first output table presents 95% confidence intervals for our population proportion.
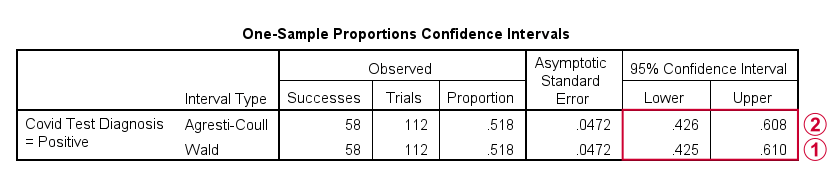
 The “normal” confidence interval (denoted as Wald) runs from .425 to .610: there's a 95% probability that these bounds enclose our population proportion. Also note that our hypothesized proportion of .60 lies within this interval of likely values.
The Agresti-Coull interval is probably a worse estimate than our “normal” confidence interval unless the sample sizes assumption is not met. I recommend ignoring it for our example data.
The second table presents the actual z-test results.
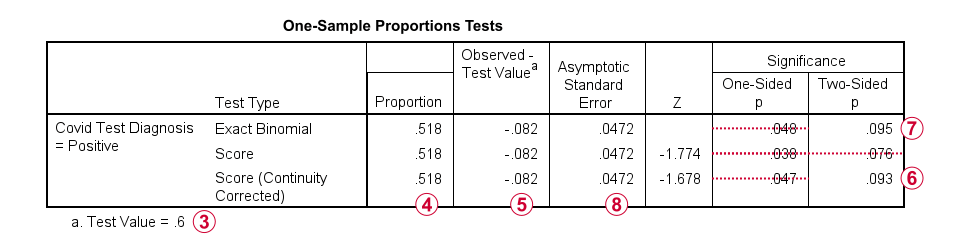
 Our hypothesized population proportion is .60.
 Our observed sample proportion is .518.
 The observed difference is .518 - .60 = -.082.
 The continuity corrected significance level is always more accurate than the uncorrected p-value. For our example, p(2-tailed) = .093. Because p > .05,
we do not reject the null hypothesis
that our population proportion = .60. That is, the difference of -.082 is not statistically significant.
The continuity corrected significance level is always more accurate than the uncorrected p-value. For our example, p(2-tailed) = .093. Because p > .05,
we do not reject the null hypothesis
that our population proportion = .60. That is, the difference of -.082 is not statistically significant.
 The binomial test yields an exact 1-tailed p-value. Its 2-tailed p-value, however, is not correct: it's exactly 2 * p(1-tailed) but this calculation is only valid if the test proportion is 0.50.
For test proportions other than 0.50, the binomial distribution is asymmetrical. This is why the “traditional” binomial test in SPSS doesn't report any p(2-tailed) in this case as can be verified by the syntax below.
sort cases by diag (d).
*Binomial test for \(\pi\)(positive) = 0.60 from analyze - nonparametric tests - legacy dialog - binomial.
NPAR TESTS
/BINOMIAL (0.60)=diag
/MISSING ANALYSIS.
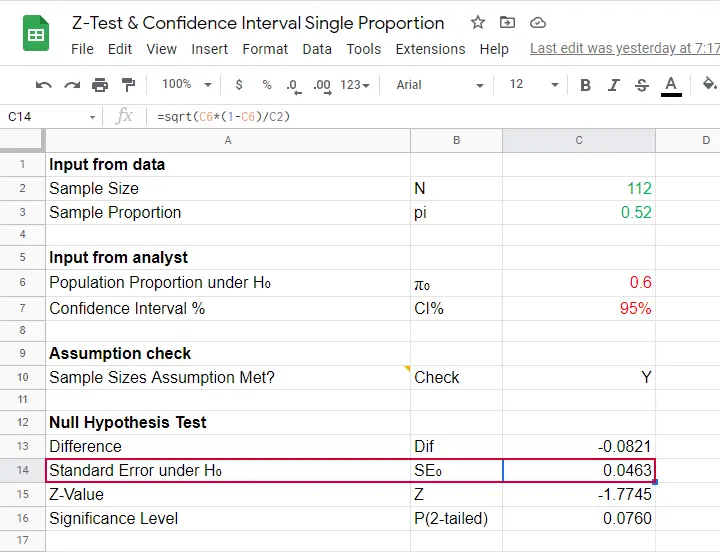
Finally, note that SPSS reports the wrong standard error. The correct standard error is .0463 as computed in this Googlesheet (read-only).
APA Style Reporting Z-Tests
The APA does not have explicit guidelines on reporting z-tests. However, it makes sense to report something like “the proportion of positive Covid-19 diagnoses did not differ significantly from 0.60, z = -1.68, p(2-tailed) = .093.” Obviously, you should also report
- your sample size;
- the observed sample proportion;
- whether the continuity correction was applied to the z-test;
- whether the Agresti-Coull correction was applied to the confidence interval.
Final Notes
Altogether, I think z-tests are rather poorly implemented in SPSS:
- the standard error for the z-test is not correct;
- p(2-tailed) for the binomial test is not correct;
- no warning is issued if sample sizes are even way insufficient to run a z-test in the first place;
- no effect size measures (such as Cohen’s H) are available;
- z-tests and confidence intervals are reported in separate tables which the end user will probably want to merge in Excel or something.
What's really good, however, is that
- z-tests in SPSS handle (even a combination of) numeric and string variables;
- several corrections for both the z-test and confidence intervals are available.
Thanks for reading!
References
- Agresti, A. & Coull, B.A. (1998). Approximate Is Better than "Exact" for Interval Estimation of Binomial Proportions The American Statistician, 52(2), 119-126.
- Agresti, A. & Franklin, C. (2014). Statistics. The Art & Science of Learning from Data. Essex: Pearson Education Limited.
- Van den Brink, W.P. & Koele, P. (1998). Statistiek, deel 2 [Statistics, part 2]. Amsterdam: Boom.
- Van den Brink, W.P. & Koele, P. (2002). Statistiek, deel 3 [Statistics, part 3]. Amsterdam: Boom.
- Twisk, J.W.R. (2016). Inleiding in de Toegepaste Biostatistiek [Introduction to Applied Biostatistics]. Houten: Bohn Stafleu van Loghum.
THIS TUTORIAL HAS 3 COMMENTS:
By bahjat on December 31st, 2022
Thanks for your efforts on this website.
I have two groups of patients, group one 50 patients who had total thyroidectomy surgery and include 23 males and 27 females while group two 48 patients who had subtotal thyroidectomy surgery and include 20 males and 28 females.
I would like to see if number of males is significantly different from number of females in group one alone or may be we can ask the question in this way (is male to female ratio in group one significantly different from a hypothesized ratio of 1 to 1 ?) and then do the same comparison in group two alone and then do a test to see if male to female ratio in group one is significantly different from male to female ratio in group two.
What statistical tests should I use?
By Ruben Geert van den Berg on January 1st, 2023
For the first question: a binomial test with a test proportion of .50 examines if a population proportion of .50 is credible.
For the second question, use a z-test for 2 independent proportions.
Keep in mind that both tests quietly assume that your data are a simple random sample from some (much) larger population, which may be hard to sell.
Hope that helps!
By Aravind on July 18th, 2024
Excellent post. I always check this blog, and I’m impressed. Great job!