Z-tests were introduced to SPSS version 27 in 2020.
This tutorial quickly walks you through z-tests for single proportions:
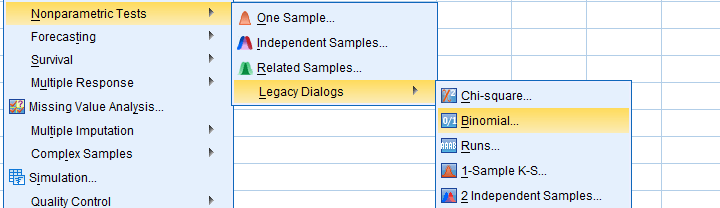
A binomial test examines if a population percentage is equal to x.
Example: is 45% of all Amsterdam citizens currently single? Or is it a different percentage?
This simple tutorial quickly walks you through the basics.
This tutorial walks you through running and interpreting a binomial test in SPSS.
With step-by-step example on downloadable practice data file.
SPSS sign test for one median the right way. Recode your outcome variable into values higher and lower than the hypothesized median and test if they're distributed 50/50 with a binomial test.
Z-tests were introduced to SPSS version 27 in 2020.
This tutorial quickly walks you through z-tests for 2 independent proportions:
The Mann-Whitney test is an alternative for the independent samples t-test when the assumptions required by the latter aren't met by the data. The most common scenario is testing a non normally distributed outcome variable in a small sample (say, n < 25).
SPSS median test evaluates if two groups of respondents have equal population medians on some variable. This easy tutorial quickly walks you through.
The Kruskal-Wallis test is a nonparametric alternative for a one-way ANOVA.
This tutorial shows when to use it and how to run it in SPSS.
SPSS Wilcoxon Signed-Ranks test is used for comparing two metric variables measured on one group of cases. It's the nonparametric alternative for a paired-samples t-test when its assumptions aren't met.
SPSS McNemar test is a procedure for testing whether the proportions of two dichotomous variables are equal. The two variables have been measured on the same cases.
SPSS sign test for two related medians tests if two variables measured in one group of people have equal population medians.
SPSS Friedman test compares the means of 3 or more variables measured on the same respondents. Like so, it is a nonparametric alternative for a repeated-measures ANOVA that's used when the latter’s assumptions aren't met.
SPSS Cochran's Q test is a procedure for testing whether the proportions of 3 or more dichotomous variables are equal. These outcome variables have been measured on the same people or other statistical units.
THIS TUTORIAL HAS 7 COMMENTS:
By Monalisa on September 21st, 2018
Great help!
By Loo on September 24th, 2018
Hi Ruben, Post hoc test is available for chi square test of independence by using standard residual method, for example for a 3 by 3 chi square table. But, is it possible to do it for a 2 by 2 table?
By Ruben Geert van den Berg on September 24th, 2018
Hi Loo!
Post hoc tests examine which proportions differ if the main chi-square independence test indicates that 2 variables are associated.
For a 2 by 2 table, however, you're comparing only 2 proportions. So there's no question which proportions differ -there's only 2 of them.
On top of that, a z-test for 2 independent proportions is preferred over the chi-square test here. The significance levels are identical but the z-test provides a confidence interval of the difference too -which is very informative. For some stupid reason, it's missing from SPSS but we built a simple tool for it.
You can also inspect the (Pearson) correlation between the 2 variables. For some dumb reason it's called a phi coefficient for 2 dichotomous variables but it's technically identical to a Pearson correlation.
Last, Bonferroni corrected pairwise z-tests for larger (2 by 3, 3 by 3...) tables are often preferred over the adjusted standardized residuals. You can request the latter by adding BPROP to the CELLS subcommand as in
CROSSTABS education BY marital_status
/CELLS COUNT COLUMN BPROP
/STATISTICS CHISQ PHI.
Note that these tests only compare column (not row!) proportions.
Hope that helps!
SPSS tutorials
By Mohamed on November 10th, 2018
Hi there
What apout IRT in spss ver 15
Tell me
Thank you
By Ruben Geert van den Berg on November 10th, 2018
Hi Mohamed!
What do you mean by "IRT"? Item Response Theory? Please clarify.
Thx!
SPSS tutorials