SPSS – How to Sort Variables Using Python?
We held a reaction time experiment in which people had to resolve 20 puzzles as fast as possible. The 20 answers and reactions times are in an SPSS data file which we named trials.sav. Part of if is shown below.
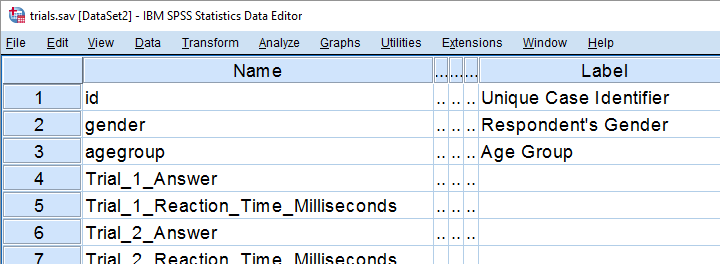
In first instance, we'd just like to inspect the histograms of our reaction time variables. The easiest way is running FREQUENCIES as shown below but specifying the right variable names is cumbersome even for this very tiny data file.
frequencies Trial_1_Reaction_Time_Milliseconds Trial_2_Reaction_Time_Milliseconds Trial_3_Reaction_Time_Milliseconds /*and so on through 20.
/format notable
/histogram.
If our reaction times were adjacent, we could address the entire block with the TO keyword. We'll therefore reorder our variables with ADD FILES as shown in SPSS - Reorder Variables with Syntax. The easiest way to get the job done is ADD FILES FILE */KEEP id to agegroup [reaction time variables here] ALL. ALL refers to all variables in our data that we haven't specified yet -in this case all answer variables. This command still requires spelling out all reaction time variables unless we have Python do that for us. Let's first just look up all variable names and proceed from there.
1. Retrieve Variable Names by Index
The spss module allows us to retrieve variable names by index. Now, we've 43 variables in our data but Python starts counting from 0. So our first and last variables should be indexed 0 and 42 by Python. Let's see if that's right by running the syntax below.
begin program python3.
import spss
print(spss.GetVariableName(0))
print(spss.GetVariableName(42))
end program.
2. Retrieve All Variable Indices
So if we can retrieve the first and last variable names by their Python indices -0 and 42- then we can retrieve all of them if we have all indices. A standard way for doing just that is using range.
Technically, range is an iterable object which means that we can loop over it. The syntax below shows how that works.
begin program python3.
for ind in range(10):
print(ind)
end program.
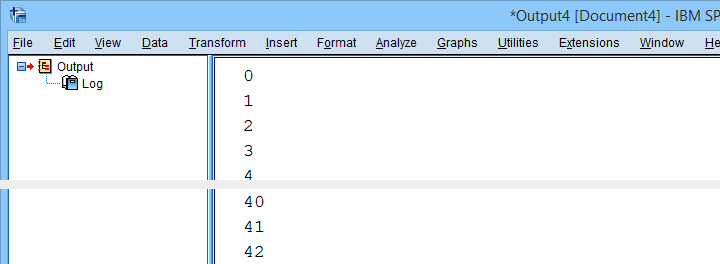
*Print all variable indices.
begin program python3.
import spss
for ind in range(spss.GetVariableCount()):
print(ind)
end program.
Result
3. Retrieve All Variable Names
We'll now run a very simple Python for loop over our variable indices. In each iteration, we'll retrieve one variable name, resulting in the names of all variables in our data. We'll filter out our target variables in the next step.
begin program python3.
import spss
for ind in range(spss.GetVariableCount()):
print(spss.GetVariableName(ind))
end program.
4. Filter Variable Names
Before we'll create and run the required syntax, we still need to filter out only those variables having “Time” in their variable names. We'll use a very simple Python if statement for doing so. The syntax below retrieves exactly our target variables.
begin program python3.
import spss
for ind in range(spss.GetVariableCount()):
varNam = spss.GetVariableName(ind)
if 'Time' in varNam:
print(varNam)
end program.
5. Create Python String Holding Target Variables
We'd like to create some SPSS syntax containing the variables we selected in the previous syntax. We'll first pass the names into a Python string we'll call timeVars. We first create it as an empty string and then concatenate each variable name and a space to it.
begin program python3.
import spss
timeVars = ''
for ind in range(spss.GetVariableCount()):
varNam = spss.GetVariableName(ind)
if 'Time' in varNam:
timeVars += varNam + ' '
print(timeVars)
end program.
Minor note: editing Python strings is considered bad practice because they're immutable. Our reason for doing so anyway is that it keeps things simple. It gets the job done just fine unless we're processing a truly massive amount of code -which we basically never do in SPSS.
6. Create Required SPSS Syntax
We're almost there. We'll now create our basic ADD FILES command as a Python string. In the syntax below, %s is a placeholder that we'll replace with our time variable names. For more details on this technique, please consult SPSS Python Text Replacement Tutorial.
begin program python3.
import spss
timeVars = ''
for ind in range(spss.GetVariableCount()):
varNam = spss.GetVariableName(ind)
if 'Time' in varNam:
timeVars += varNam + ' '
spssSyntax = "ADD FILES FILE */KEEP id to agegroup %s ALL."%timeVars
print(spssSyntax)
end program.
7. Create and Run Desired Syntax
Let's take a close look at the syntax we just created. Is it exactly what we need? Sure? Then we'll comment out the print command and run our syntax with spss.Submit instead.
begin program python3.
import spss
timeVars = ''
for ind in range(spss.GetVariableCount()):
varNam = spss.GetVariableName(ind)
if 'Time' in varNam:
timeVars += varNam + ' '
spssSyntax = "ADD FILES FILE */KEEP id to agegroup %s ALL."%timeVars
#print spssSyntax
spss.Submit(spssSyntax)
end program.
execute.
8. Run Histograms
Now that we nicely sorted our variables, running the desired histograms is easily done with the TO keyword as shown below.
frequencies Trial_1_Reaction_Time_Milliseconds to Trial_20_Reaction_Time_Milliseconds
/format notable
/histogram.
Although we got our first job done, we're rather dissatisfied with the crazy long variable names. In our humble opinion, variable names should be short and simple. More elaborate descriptions of what variables mean should go into their variable labels.
We're going to do just that in our next lesson.
Let's move on.
Set SPSS Variable Names as Labels with Python
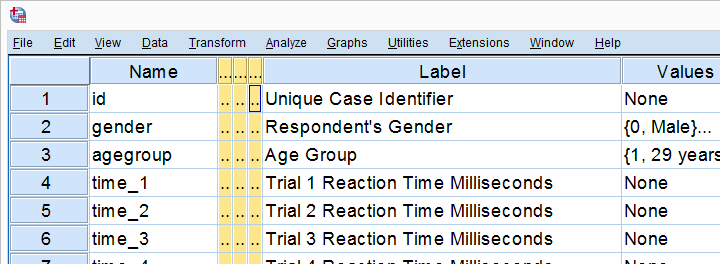
Our previous lesson started out with a rather problematic data file. We reordered our variables with Python and saved our data as trials-ordered.sav, the starting point for this lesson. The screenshot below shows part of the data.
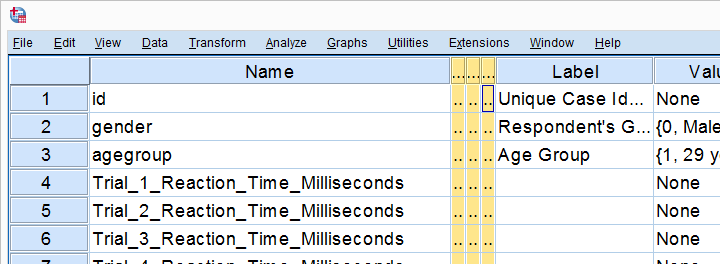
We find the long variable names problematic for two reasons: first, typing them into a syntax window is too much work and results in overly long, unmanageable syntax. More importantly, the underscores don't look nice in our output but variable names can't hold spaces instead.
We'll therefore set our variable names as variable labels and replace the underscores by spaces. Finally, we'll replace the long names by nice and short ones.
1. Retrieve All Variable Names from Data
Retrieving all variable names from our data is a standard technique that we cover in Sort Variables in SPSS with Python. We'll do it with the syntax below once again.
begin program python3.
import spss
for ind in range(spss.GetVariableCount()):
varNam = spss.GetVariableName(ind)
print(varNam)
end program.
2. Retrieve All Variable Labels from Data
Note that our first 3 variables already have a label. In order to ensure we don't overwrite them, we'll now inspect all variable labels as well, which is a simple function covered by the spss module.
begin program python3.
import spss
for ind in range(spss.GetVariableCount()):
varNam = spss.GetVariableName(ind)
varLab = spss.GetVariableLabel(ind)
print(varLab)
end program.
3. Create Variable Labels with Python
If some variable does not have a label yet, Python will return an empty string. We'll check if this holds with if not varLab:, which is True if the label is empty. For those variables, we'll create a variable label by replacing the underscores in their names by spaces. For now, we'll just print these labels.
begin program python3.
import spss
for ind in range(spss.GetVariableCount()):
varNam = spss.GetVariableName(ind)
varLab = spss.GetVariableLabel(ind)
if not varLab: # True if varLab is empty string (no VARIABLE LABEL set)
varLab = varNam.replace("_"," ")
print(varLab)
end program.
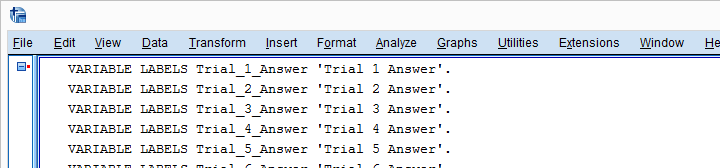
4. Create VARIABLE LABELS Commands
We'll now create and inspect VARIABLE LABELS commands with
"VARIABLE LABELS %s '%s'."%(varNam,varLab)
The first %s is replaced by the variable name, the second by its newly created label. This technique is explained in SPSS Python Text Replacement Tutorial.
begin program python3.
import spss
for ind in range(spss.GetVariableCount()):
varNam = spss.GetVariableName(ind)
varLab = spss.GetVariableLabel(ind)
if not varLab:
varLab = varNam.replace("_"," ")
print("VARIABLE LABELS %s '%s'."%(varNam,varLab))
end program.
Note: since we use single quotes around the variable label, there may be no single quotes within it. This is no issue here but if it is, escape each single quote within the label with 2 single quotes.
Result
5. Run VARIABLE LABELS Commands
Since our VARIABLE LABELS commands look fine, we'll now have Python run them in SPSS. We basically just replace print with spss.Submit and add some parentheses. This concludes the first part of our job.
begin program python3.
import spss
for ind in range(spss.GetVariableCount()):
varNam = spss.GetVariableName(ind)
varLab = spss.GetVariableLabel(ind)
if not varLab:
varLab = varNam.replace("_"," ")
spss.Submit("VARIABLE LABELS %s '%s'."%(varNam,varLab))
end program.
6. RENAME VARIABLES
At this point, at least our output will look good if we display only variable labels (not names) with SET TVARS LABELS. However, we still prefer nice and short variable names. If we use the TO keyword, a single line RENAME VARIABLES command does the trick for us.
rename variables(Trial_1_Reaction_Time_Milliseconds to Trial_20_Answer = time_1 to time_20 answer_1 to answer_20).
Final Result
As shown, our variable names are now nice and short and we've decent variable labels as well. This'll surely pay off when further editing or analyzing these data...
Thanks for reading!
Looping over SPSS Commands with Python
A nasty limitation of SPSS is that some commands take only one variable. Now, DO REPEAT and LOOP allow us to loop over variables but they are limited to SPSS transformation commands.
Python, however, allows us to loop over any command. On top of that, we can use the TO keyword, thus circumventing the need to spell out all variable names.
This lesson -covering both techniques- is among the most important of this course. Let's dive in!
Population Pyramids
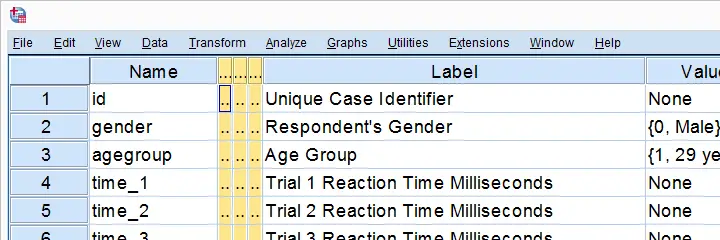
We previously cleaned up some reaction time data and this resulted in trials-renamed.sav, part of which is shown below.
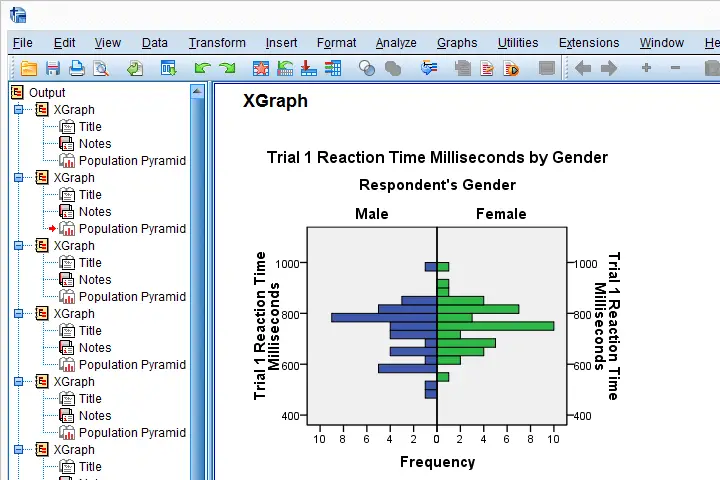
We'd now like to visualize the performance of our female versus male participants. A great way for doing so is running population pyramids. They allow for a “quick and dirty” comparison of
- means,
- standard deviations,
- skewnesses,
- outliers
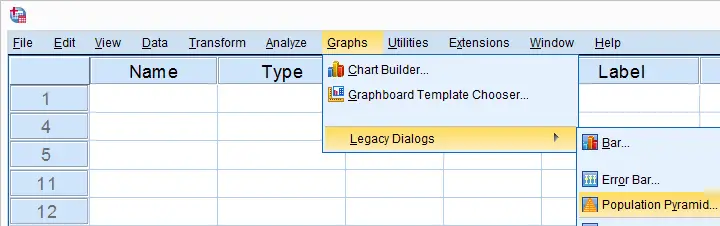
and so on between males and females. We'll first just create one by following the screenshots below.
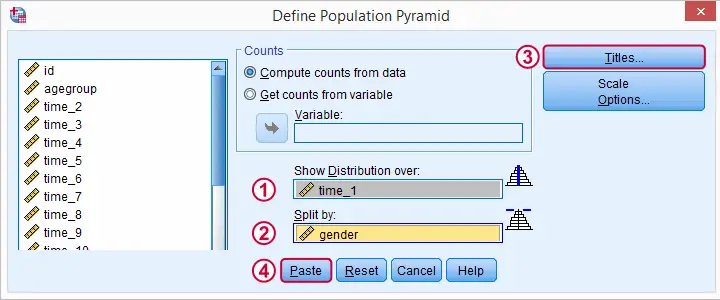
SPSS Population Pyramid Syntax
XGRAPH CHART=[HISTOBAR] BY time_1[s] BY gender[c]
/COORDINATE SPLIT=YES
/BIN START=AUTO SIZE=AUTO
/TITLES TITLE='Reaction Time by Gender'.
Apparently, we need 4 lines of syntax for one population pyramid and we'd like to have a quick peek at 20 of them.Admittedly, we could shorten the syntax somewhat but let's not waste time on it. So we need at least 80 lines of syntax. Right?
Expanding SPSS’ TO Keyword
Wrong. As in previous lessons, we'll have Python loop over this command and use a different variable name in each iteration. In this case, our reaction time variables have such simple names that we can generate all of them with a Python list comprehension like ["time_%s"%ind for ind in range(1,21)] But what about variable names that don't follow such a simple pattern? In SPSS, we'll usually specify a block of variables with the first and last variable names separated by SPSS’ TO keyword. Additional variables may be added, separated by spaces as in time_1 time_3 to time_6 time_8 time_12 Python can expand this SPSS variable specification into a Python list of variable names. This is among the most important SPSS Python techniques and it's demonstrated below.
begin program python3.
import spssaux
sDict = spssaux.VariableDict(caseless = True)
varList = sDict.expand("tiME_1 to time_20")
print(varList)
end program.
Note: since Python is case sensitive, we often need to use the correct casing for variable names and any other SPSS objects. For VariableDict(), however, adding caseless = True allows us to use any casing we like, which is usually all lowercase.
Running our Population Pyramids
We can now use a simple Python for loop for iterating over our XGRAPH commands. In each iteration, Python replaces %s with a variable name. This gets our job done.
begin program python3.
import spssaux,spss
sDict = spssaux.VariableDict(caseless = True)
varList = sDict.expand("time_1 to time_20")
for var in varList:
spss.Submit('''
XGRAPH CHART=[HISTOBAR] BY %s[s] BY gender[c]
/COORDINATE SPLIT=YES
/BIN START=AUTO SIZE=AUTO
/TITLES TITLE='Reaction Time by Gender'.
'''%var)
end program.
Result
Insert Variable Labels into Titles
We got our basic job done. However, we'll now insert our variable labels into our chart titles. Now,
spss.GetVariableLabel()
can retrieve variable labels by variable indices. For getting variable labels by variable names, however, the aforementioned VariableDict() object comes in handy (line 8, below).
In our final example, we have two text replacements in each XGRAPH command. When using multiple text replacements, using locals() is often a nice way to get things done.
begin program python3.
import spssaux,spss
sDict = spssaux.VariableDict(caseless = True)
varList = sDict.expand("time_1 to time_20")
for var in varList:
varLab = sDict[var].VariableLabel
spss.Submit('''
XGRAPH CHART=[HISTOBAR] BY %(var)s[s] BY gender[c]
/COORDINATE SPLIT=YES
/BIN START=AUTO SIZE=AUTO
/TITLES TITLE='%(varLab)s by Gender'.
'''%locals())
end program.
So I guess that'll do for this lesson. If you've any feedback, please let us know.
Hope you found it helpful!
SPSS – Extract ISO Weeks from Date Variable
For 2022, the Spring holidays in the Netherlands fall in week 8. Now, this “week 8” refers to ISO week 8, 2022, which runs from 21 through 28 February 2022.
Now, if we've an SPSS data file containing dates, how can we extract ISO week numbers from those? We'll quickly walk you through.
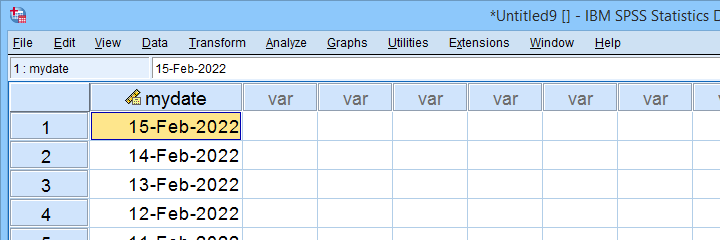
Creating Test Data
Let's first create some test data: the syntax below creates an SPSS date variable for today and its previous 999 days.
input program.
loop mydate = 1 to 1000.
end case.
end loop.
end file.
end input program.
execute.
compute mydate = datesum($time,-mydate + 1,'days').
execute.
formats mydate (date11).
Result
SPSS’ Nonsensical Week Numbers
Right. Now, SPSS seems able to extract week numbers, which is done with something like compute week = xdate.week(mydate). Sadly, these week numbers are nonsensical and useless as discussed in SPSS Computes Wrong Week Numbers? For example, some weeks may consist of only a single day as shown below.
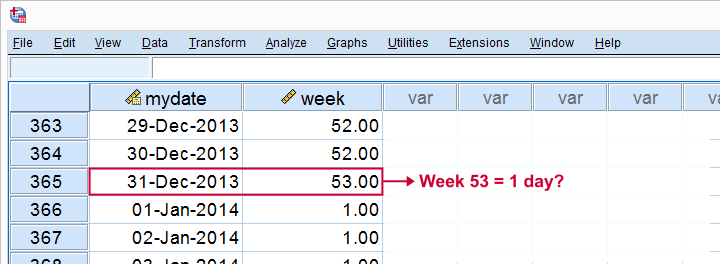
In short: SPSS can't extract “normal” week numbers from dates. However, Python presents us with a workaround.
Week Numbers from Python Isocalendar
Python's datetime module contains an ISO calendar. Given a Python datetime object, this returns a tuple containing its ISO year, week and day.
Fortunately, the datetime module is part of the SPSS Python Essentials so there's no need for installing it. The syntax below presents a very quick example for how to use it.
begin program python3.
import datetime
myDate = datetime.datetime(2022,1,1,8,31,0)
print("My date is {}.".format(myDate))
print("But my ISOdate is {}.".format(myDate.isocalendar()))
end program.
Result
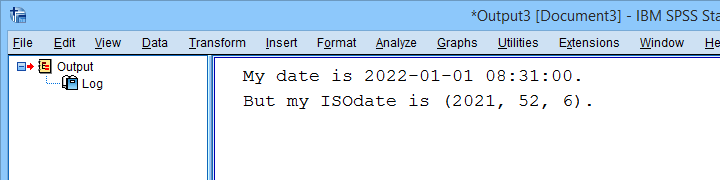
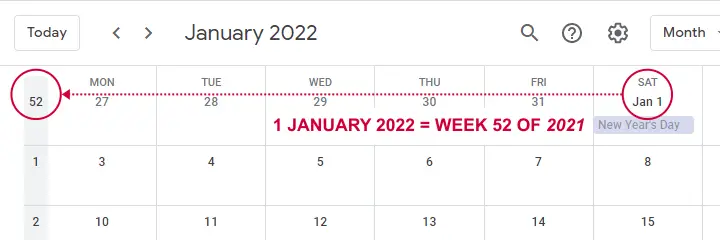
Note that 1 January 2022 falls in ISO week 52 for 2021. Our Google calendar confirms that this is correct as shown below.
Right. So now we're left with 2 challenges:
- convert our SPSS date values in Python datetime objects and
- apply the Python isocalendar to an SPSS data file.
The first step is done with the CvtSpssDatetime function from the spssdata module. Next up, we can apply any Python function to one or many SPSS variables with an SPSS extension: Programmability Transformation as found under
![]() If this is not present in your SPSS version, you may download and install SPSSINC_TRANS.spe from this Github page.
Let's now apply both fixes with our final syntax below.
If this is not present in your SPSS version, you may download and install SPSSINC_TRANS.spe from this Github page.
Let's now apply both fixes with our final syntax below.
Final Syntax
begin program python3.
import datetime
from spssdata import CvtSpssDatetime
def iso(spssdate):
return CvtSpssDatetime(spssdate).isocalendar()
end program.
*APPLY FUNCTION TO SPSS VARIABLE.
spssinc trans result=isoyear isoweek isoday TYPE = 0
/formula "iso(mydate)".
Result
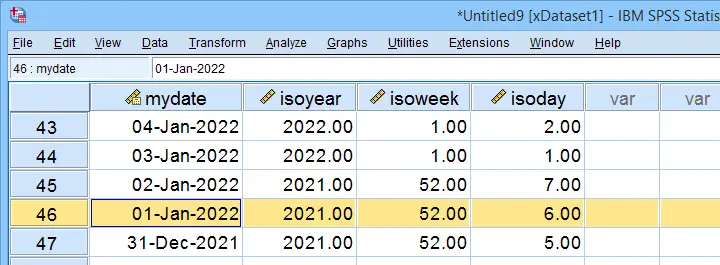
As shown, we have now correctly added the ISO year, week and day for our SPSS date variable.
Final Notes
Before I round off, I'd like to emphasize that SPSSINC TRANS is useful for many more interesting challenges such as
- applying regular expressions to SPSS string variables;
- sorting values within cases;
- applying some normalizing transformations that aren't present in SPSS (asinh, third power root).
This extension really deserves a separate tutorial and I may write just that if my time will permit it.
Credits
I'd like to thank my dear colleague Jon Peck for creating the SPSSINC TRANS extension as well as the final syntax for this tutorial.
SPSS – Edit Value Labels with Python
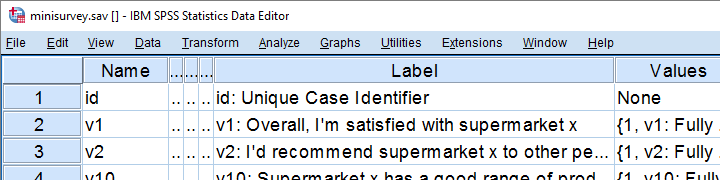
A local supermarket held a small survey, the data of which are in minisurvey.sav. Unfortunately, the software for downloading the data in SPSS format prefixes all variable and value labels with the variable names. The screenshot below shows part of the data.
Undesired Prefixes in Value Labels
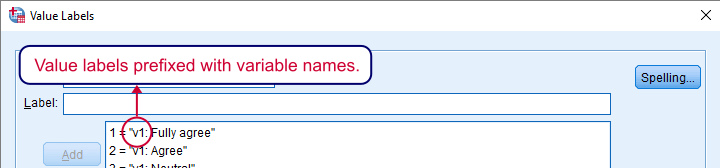
Clicking on some value labels in variable view confirms that they've undesired prefixes as shown below. Obviously, we don't want to see these value labels in our output but we don't want to adjust all of them manually either. Fortunately, SPSS with Python allows us to fix the problem with just a few lines of code.
Removing Characters with Python
First off, you need to have the SPSS Python Essentials properly installed for running this tutorial’s syntax. We'll first create a string holding just one value label. We adjust it by extracting a substring in Python. Precisely, we want characters 9 through last. Since Python starts counting at 0, valLab[8:] does just that.
begin program python3.
valLab = 'v13_2A: Neutral'
print(valLab[8:])
end program.
Finding the Colon in our Label
Unfortunately, our prefixes have different lengths so we can't just extract characters 9 through last. However, we do see that the prefixes always end with a colon and a space. The position of the (first) colon is found with find and tells us which characters to extract.
begin program python3.
print(valLab.find(": "))
end program.
Fixing One Value Label
Our colon and space occur at position 6. Because we want our label to start after these 2 characters, we'll add another 2 to it as shown below. In short, valLab[valLab.find(": ") + 2:] always returns the desired value label.
begin program python3.
valLab = 'v1: Neutral'
print(valLab[valLab.find(": ") + 2:])
end program.
Result
Look up SPSS Dictionary Information
We can easily look up SPSS dictionary information with the Python spss module. Some examples are
spss.GetVariableName(ind)spss.GetVariableLabel(ind)spss.GetVariableType(ind)spss.GetVariableFormat(ind)
where ind is the Python variable index (0 for the first variable, 1 for the second and so on). For value labels, however, we prefer using VariableDict() from the spssaux module. But let's first just find all variable names.
begin program python3.
import spssaux
sDict = spssaux.VariableDict()
for var in sDict:
print(var,type(var))
end program.
Result
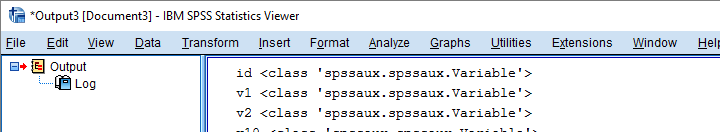
Look up Value Labels
We'll now look up our value labels. For each variable, we'll get a Python dictionary holding each labeled value and its label. Don't confuse a Python dict object with the SPSS dictionary; these are totally unrelated.
begin program python3.
import spssaux
sDict = spssaux.VariableDict()
for var in sDict:
valLabs = var.ValueLabels
print(valLabs)
end program.
Result
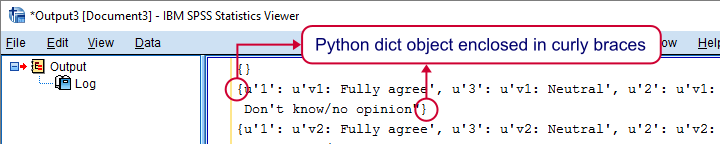
Loop Over Values and Labels
A Python dict holds key-value pairs of which the keys are unique within the dict. We'll loop over these pairs and look up the key and value by using iteritems() as shown below.
begin program python3.
import spssaux
sDict = spssaux.VariableDict()
for var in sDict:
valLabs = var.ValueLabels
for key,val in valLabs.items():
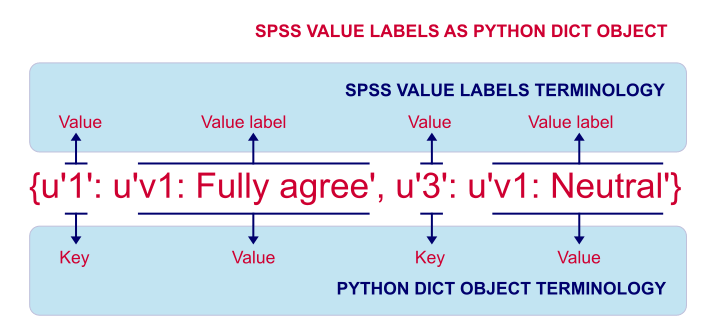
print(key,val)
end program.
A major source of confusion here is that SPSS values are keys in our Python dict. The Python dict values hold SPSS value labels. The figure below illustrates this mapping.
Create ADD VALUE LABELS Commands
So far, our syntax finds all variable names, values and value labels. Inserting these into ADD VALUE LABELS commands will set all value labels for the entire dataset. We'll create this syntax by concatenating these commands in a loop. Note that \n adds a line break after each line.
begin program python3.
import spssaux
spssSyntax = ''
sDict = spssaux.VariableDict()
for var in sDict:
valLabs = var.ValueLabels
for key,val in valLabs.items():
spssSyntax += "ADD VALUE LABELS %s %s '%s'.\n"%(var,key,val)
print(spssSyntax)
end program.
Create Syntax for Adjusting Value Labels
At this point we'll add the correction for each value label that we developed earlier. The resulting syntax is almost what we need. Bonus points if you detect a problem with it before reading on.
begin program python3.
import spssaux
spssSyntax = ''
sDict = spssaux.VariableDict()
for var in sDict:
valLabs = var.ValueLabels
for key,val in valLabs.items():
val = val[val.find(": ") + 2:]
spssSyntax += "ADD VALUE LABELS %s %s '%s'.\n"%(var,key,val)
print(spssSyntax)
end program.
Result
If you're really good with SPSS, you'll see that some value labels contain a single quote. Since the labels are enclosed in single quotes too, they'll end the label prematurely. In Python, we'd escape them with \' but this is SPSS syntax so we need '' instead.
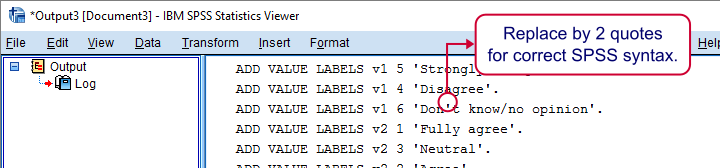
Final Syntax
We'll now replace all single quotes within value labels by two single quotes. Second, we'll check if the colon and space we're looking for are actually present in each label and if not, we'll skip it. Third, we'll now run our SPSS syntax with spss.Submit so we need to import the spss module as well as spssaux.
begin program python3.
import spssaux,spss
spssSyntax = ''
sDict = spssaux.VariableDict()
for var in sDict:
valLabs = var.ValueLabels
for key,val in valLabs.items():
if(": ") in val:
val = val[val.find(": ") + 2:]
val = val.replace("'","''")
spssSyntax += "ADD VALUE LABELS %s %s '%s'.\n"%(var,key,val)
spss.Submit(spssSyntax)
end program.
*We're all done after running this.
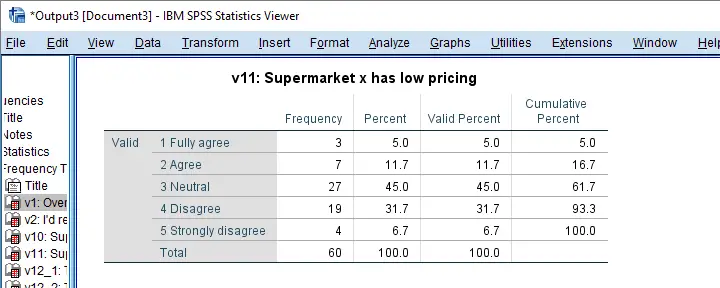
Final Notes
Our final syntax does the job: when running FREQUENCIES or some other command, we'll have nice, clean value labels in our output. I'm sure our clients will appreciate it.
The syntax could be shorter but it's simple and readable. You can easily modify it for capitalizing value labels or removing unwanted characters from them. I hope this tutorial also shows how to develop SPSS Python syntax in small steps.
Thanks for reading!