On 19 June 2020, SPSS version 27 was released. Although it has some useful new features, most of these have been poorly implemented. This review quickly walks you through the main improvements and their limitations.
- Cohen’s D - Effect Size for T-Tests
- SPSS 27 - Power & Sample Size Calculations
- APA Frequency Tables
- Python Version 2.x Deprecated
- SPSS’ Search Function
- Bootstrapping Included in SPSS Base
Cohen’s D - Effect Size for T-Tests
Cohen’s D is the main effect size measure for all 3 t-tests:
- the independent samples t-test,
- the paired samples t-test and
- the one sample t-test.
SPSS users have been complaining for ages about Cohen’s D being absent from SPSS. However, SPSS 27 finally includes it as shown below.
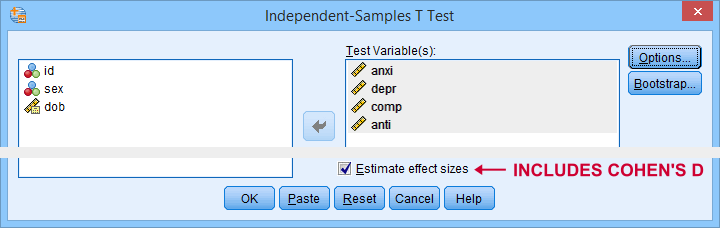
The only way to obtain Cohen’s D is selecting “Estimate effect sizes”. Sadly, this results in a separate table that contains way more output than we typically want.

So why does this suck?
- The APA reporting guidelines ask for a single table containing the significance tests and Cohen’s D. Meeting this standard requires copy-pasting results from separate SPSS tables manually -never a good idea.
- The excessive output confuses users. I'll bet a monthly salary that the “Standardizer” instead of the “Point estimate” will be reported as Cohen’s D on a pretty regular basis.
So what's the right way to go?
The right way to go is found in JASP. The figure below shows how it implements Cohen’s D.
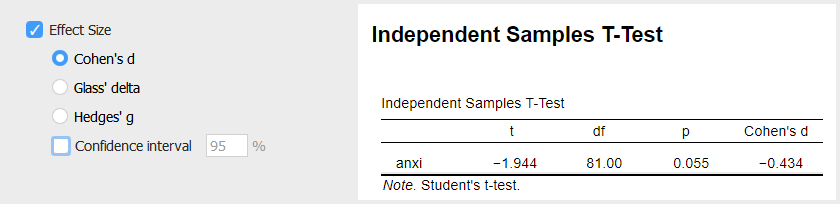
So what makes this better than the SPSS implementation? Well,
- JASP allows us to choose which effect size measure it reports;
- we can choose which confidence interval it reports -optionally none;
- JASP reports all results in a single table;
- Cohen’s D is called “Cohen’s d” rather than “Point estimate”.
Power & Sample Size Calculations - The Basics
Before we turn to power calculations in SPSS 27, let's first revisit some minimal basics.
Computing power or required sample sizes involves 4 statistics:
- α -often 0.05- is the probability of making a Type I error: rejecting some null hypothesis if it's actually true;
- (1 - β) or power -often 0.80- is the probability of rejecting some null hypothesis given some exact alternative hypothesis, often expressed as an effect size;
- effect size is a standardized number that summarizes to what extent some null hypothesis is not true -either in a sample or a population;
- sample size is the number of independent observations involved in some significance test.
We can compute each of these 4 statistics if we know the other 3. In practice, we usually don't know these but we can still make educated guesses. These result in different scenarios that can easily be calculated. This is mostly done for
- computing required sample sizes for different effect sizes given a chosen α and (1 - β);
- computing power for different sample sizes given a chosen α and (1 - β).
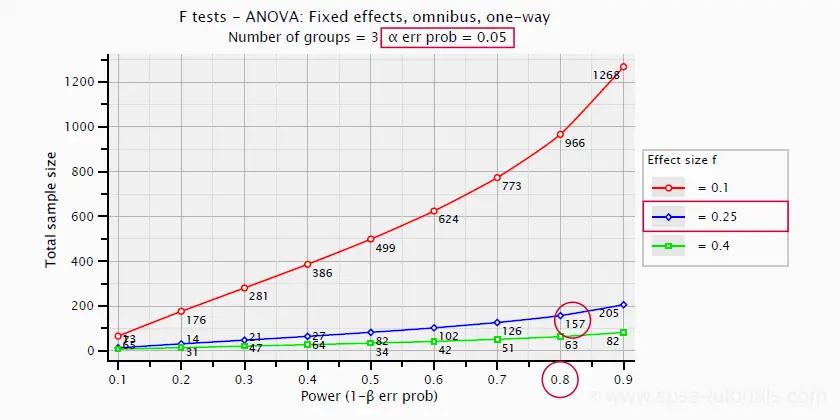
So let's say we want compare 3 different medicines. We're planning a 3-group ANOVA at α = 0.05 and we want (1 - β) = 0.80. We guess that the effect size, Cohen’s f = 0.25 (medium).
Given this scenario, we should use a total sample size of N = 157 participants as shown below.
SPSS 27 - Power & Sample Size Calculations
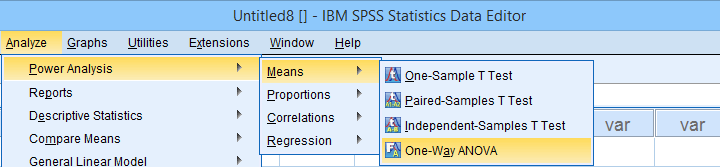
Now let's say we want to know the required sample size for a 4-way ANOVA. We'll first open the power analysis dialog as shown below.
In the dialog that opens (below),
 we'll select “Estimate sample size”
 we'll enter the power or (1 - β) we desire;
 we'll enter the alpha level or α at which we're planning to test.
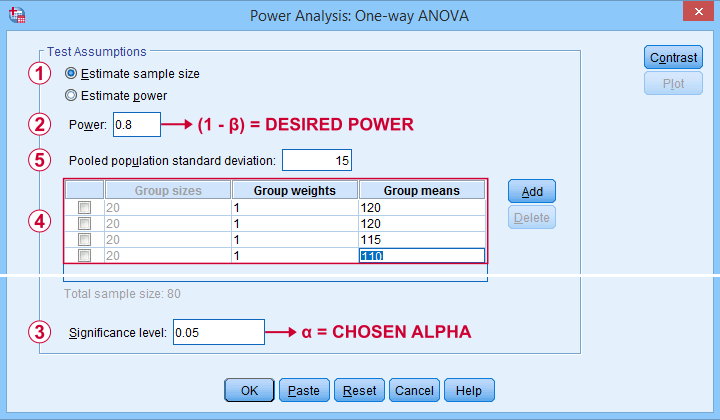
Our sample size calculation requires just one more number: the expected effect size. But for some very stupid reason,
we can't enter any effect size in this dialog.
Instead, SPSS will compute it for us if we enter
 all expected means and
 the expected Pooled population standard deviation.
The problem is that you probably won't have a clue what to enter here: since we run this analysis before collecting any data, we can't look up the required statistics.
So how does effect size make that situation any better? Well, first off, effect size is a single number as opposed to the separate numbers required by the dialog. And because it's a single number, we can consult simple rules of thumb such as
- f = 0.10 indicates a small effect;
- f = 0.25 indicates a medium effect;
- f = 0.40 indicates a large effect.
Such estimated effect sizes can be directly entered in G*Power as shown below. It does not require 4 (unknown) means and an (unknown) standard deviation. However, you can optionally compute effect size from these numbers and proceed from there.
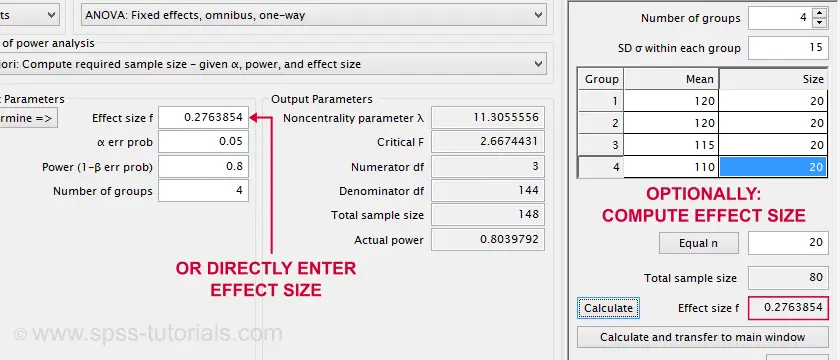
Note that the GPower dialog also contains the main output: we should collect data on a total sample size of N = 148 independent observations.
Next, we reran this analysis in SPSS 27. The output is shown below.
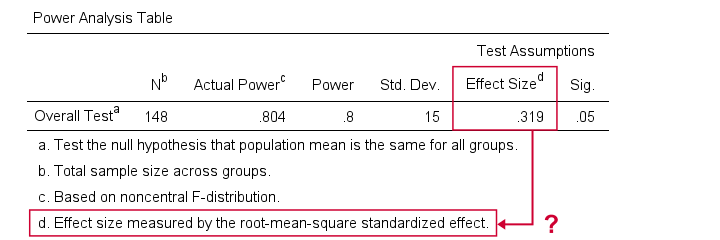 Sample size calculation output example from SPSS 27
Fortunately, the SPSS and GPower conclusions are almost identical. But for some weird reason, SPSS reports the “root-mean-square standardized effect” as its effect size measure.
Common effect size measures for ANOVA are
- η2 or (partial) eta-squared;
- ω2 or omega-squared;
- Cohen’s f.
The aforementioned output includes none of those. Reversely, (partial) eta-squared is the only effect size measure we obtain if we actually run the ANOVA in SPSS.
We could now look into the plots from SPSS power analysis. Or we could discuss why chi-square tests are completely absent. But let's not waste time.
SPSS power analysis is pathetic.
Use GPower instead.
APA Frequency Tables
Basic frequency distributions are the most fundamental tables in all of statistics. Sadly, those in SPSS are confusing to users and don't comply with APA guidelines. That's why we published Creating APA Style Frequency Tables in SPSS some years ago.
SPSS 27 finally offers similar tables. For creating them, navigate to
![]()
![]() and follow the steps below.
and follow the steps below.
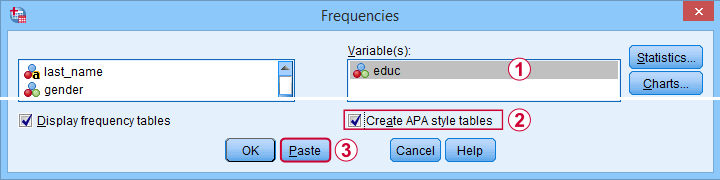
These steps result in the syntax below.
FREQUENCIES VARIABLES=educ jtype
/ORDER=ANALYSIS.
OUTPUT MODIFY
/REPORT PRINTREPORT=NO
/SELECT TABLES
/IF COMMANDS=["Frequencies(LAST)"] SUBTYPES="Frequencies"
/TABLECELLS SELECT=[VALIDPERCENT] APPLYTO=COLUMN HIDE=YES
/TABLECELLS SELECT=[CUMULATIVEPERCENT] APPLYTO=COLUMN HIDE=YES
/TABLECELLS SELECT=[TOTAL] SELECTCONDITION=PARENT(VALID) APPLYTO=ROW HIDE=YES
/TABLECELLS SELECT=[TOTAL] SELECTCONDITION=PARENT(MISSING) APPLYTO=ROW HIDE=YES
/TABLECELLS SELECT=[VALID] APPLYTO=ROWHEADER UNGROUP=YES
/TABLECELLS SELECT=[PERCENT] SELECTDIMENSION=COLUMNS FORMAT="PCT" APPLYTO=COLUMN
/TABLECELLS SELECT=[COUNT] APPLYTO=COLUMNHEADER REPLACE="N"
/TABLECELLS SELECT=[PERCENT] APPLYTO=COLUMNHEADER REPLACE="%".
A standard FREQUENCIES command creates the tables and OUTPUT MODIFY then adjusts them. This may work but it requires 14 lines of syntax. Our approach -combining COMPUTE and MEANS- requires only 3 as shown below.
compute constant = 0.
means constant by educ jtype
/cells count npct.
*Optionally, set nicer column headers.
output modify
/select tables
/if commands = ["means(last)"]
/tablecells select = [percent] applyto = columnheader replace = '%'.
So why does SPSS 27 need 14 lines of syntax if we really need only 3? Surely, it must create much better output, right? Well... No. Let's carefully compare the results from both approaches.
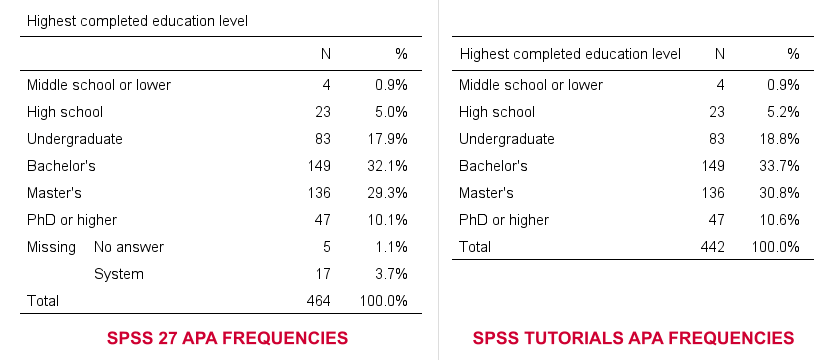
- The SPSS 27 approach always includes user missing values -whether you want it or not. The only way to exclude them is using some type of FILTER. Note that you probably need different filters for different tables -very tedious indeed.
- By default, our approach excludes user missing values. However, you can choose to include them by adding /MISSING INCLUDE to the MEANS command. This also works fine if you run many tables in one go.
- SPSS 27 always includes system missing values.
- Our approach never includes system missing values. However, you can include them if you RECODE them into user missing values, possibly preceded by TEMPORARY.
In short, we feel the SPSS 27 approach is worse on all accounts than what we proposed in Creating APA Style Frequency Tables in SPSS some years ago.
Python Version 2.x Deprecated
By default, SPSS 27 no longer supports Python 2.x. This makes sense because the Python developers themselves deprecated version 2 around April 2020.
For us, it's bad new because we're still using tons of scripts and tools in Python 2. We're well aware that we should rewrite those in Python 3 but we don't have the time for it now. Fortunately,
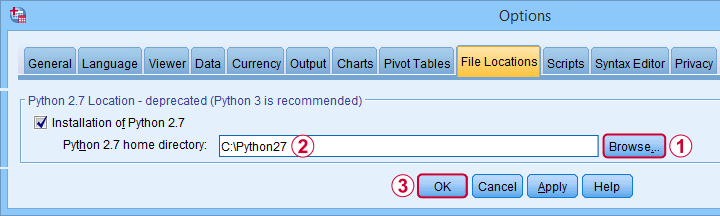
you can still use Python 2 in SPSS 27.
First, simply install Python 2.7 on your system. Next, navigate to
![]() and select the tab. Finally, Follow the steps shown below.
and select the tab. Finally, Follow the steps shown below.
After completing these steps, you can use Python 2 in SPSS 27. One issue, however, is that SPSS throws a >Warning # 8501 Command name: begin program each time you run anything in Python 2. If you run a large number of Python 2 blocks, this becomes seriously annoying.
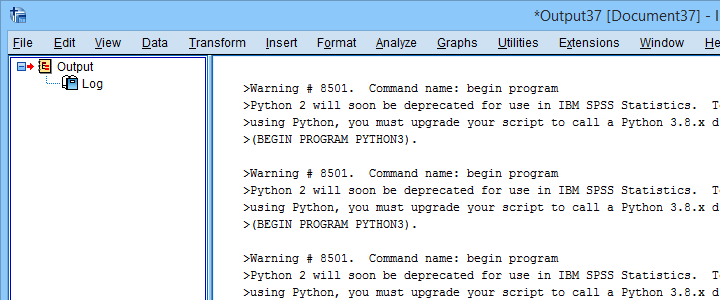
You can prevent these warnings by running SET ERRORS NONE. prior to running any Python blocks. After you're done with those, make sure you switch the errors back on by running SET ERRORS LISTING. This is a pretty poor solution, though. We tried to prevent only the aforementioned Warning # 8501 but we didn't find any way to get it done.
Last but not least, deprecating Python 2 in favor of Python 3 probably causes compatibility issues: SPSS versions 13-23 can only be used with Python 2, not Python 3. So for these SPSS versions, we must build our tools in Python 2. Sadly, those tools won't work “out of the box” anymore with SPSS 27.
SPSS’ Search Function
SPSS 27 comes with a search function that supposedly finds “help topics, dialogs and case studies”. Our very first attempt was searching for “kruskal” for finding information on the Kruskal-Wallis test. Although SPSS obviously includes this test, the search dialog came up with zero results.
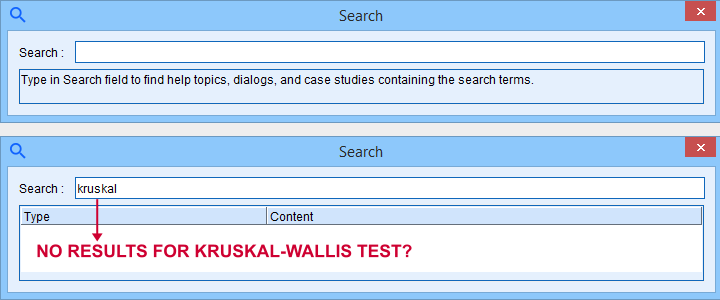
We didn't explore the search function any further.
Bootstrapping Included in SPSS Base
Very basically, bootstrapping estimates standard errors and sampling distributions. It does so by simulating a simple random sampling procedure by resampling observations from a sample. Like so, it doesn't rely on the usual statistical assumptions such as normally distributed variables.
Traditionally, you could bootstrap statistics in SPSS by using
- a macro (this is how the PROCESS dialog bootstraps its results);
- an SPSS Python script or;
- the Bootstrap option: an SPSS add-on module which requires an additional license.
SPSS 27 no longer requires the aforementioned additional license: it includes the Bootstrap option by default. This is a nice little bonus for SPSS users upgrading from previous versions.
Conclusions
The good news about SPSS 27 is that it implements some useful new features that users actually need. Some examples covered in this review are
- Cohen’s D for t-tests;
- APA frequency tables and;
- power and sample size calculations.
The bad news, however, is that these features have been poorly implemented. They look and feel as if they were developed solely by statisticians and programmers without consulting any
- SPSS users;
- UX professionals;
- competing software -most notably JASP and GPower.
The end result looks like a poor attempt at reinventing the wheel.
So that's what we think. So what about you? Did you try SPSS 27 and what do you think about it? Let us know by throwing a quick comment below. We love to hear from you.
Thanks for reading!
THIS TUTORIAL HAS 6 COMMENTS:
By Ruben Geert van den Berg on November 25th, 2021
Hi Cecil!
That's because it used to be absent through SPSS version 26. Only the newest tutorials cover it.
For a much better tutorial on this (written 2 weeks ago), I highly recommend SPSS Independent Samples T-Test.
Hope that helps!
SPSS tutorials