- SPSS PROCESS Dialogs
- SPSS PROCESS Output
- Mediation Summary Diagram & Conclusion
- Indirect Effect and Index of Mediation
- APA Reporting Mediation Analysis
Introduction
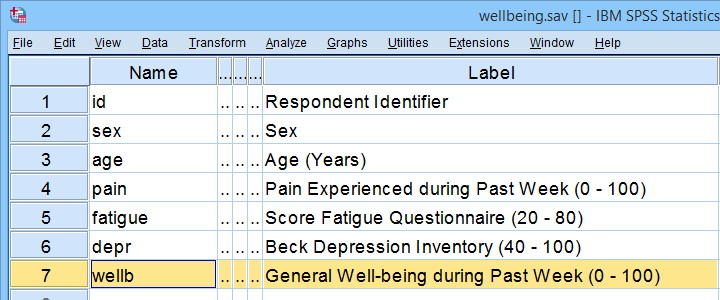
A study investigated general well-being among a random sample of N = 421 hospital patients. Some of these data are in wellbeing.sav, partly shown below.
One investigator believes that
- pain increases fatigue and
- fatigue -in turn- decreases overall well-being.
That is, the relation from pain onto well-being is thought to be mediated by fatigue, as visualized below (top half).
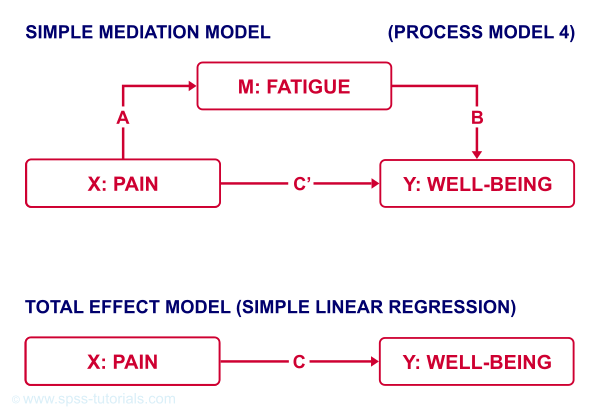
Besides this indirect effect through fatigue, pain could also directly affect well-being (top half, path \(c\,'\)).
Now, what would happen if this model were correct and we'd (erroneously) leave fatigue out of it? Well, in this case the direct and indirect effects would be added up into a total effect (path \(c\), lower half). If all these hypotheses are correct, we should see the following in our data:
- assuming sufficient sample size, paths \(a\) and \(b\) should both be significant;
- path \(c\,'\) (direct effect) should be different from \(c\) (total effect).
One approach to such a mediation analysis is a series of (linear) regression analyses as discussed in SPSS Mediation Analysis Tutorial. An alternative, however, is using the SPSS PROCESS macro as we'll demonstrate below.
Quick Data Checks
Rather than blindly jumping into some advanced analyses, let's first see if our data look plausible in the first place. As a quick check, let's inspect the histograms of all variables involved. We'll do so from the SPSS syntax below. For more details, consult Creating Histograms in SPSS.
frequencies pain fatigue wellb
/format notable
/histogram.
Result
First off, note that all variables have N = 421 so there's no missing values. This is important to make sure because PROCESS can only handle cases that are complete on all variables involved in the analysis.
Second, there seem to be some slight outliers. This especially holds for fatigue as shown below.
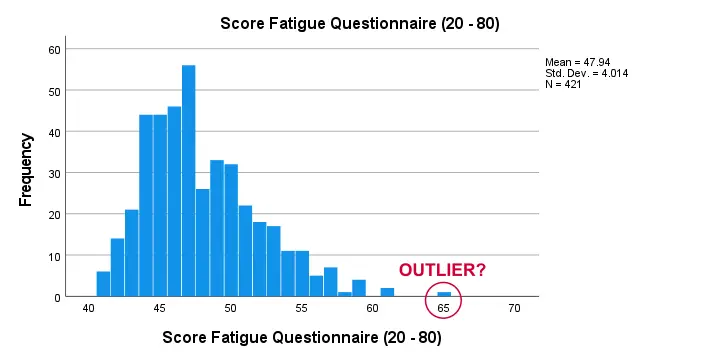
I think these values still look pretty plausible and I don't expect them to have a major impact on our analyses. Although disputable, I'll leave them in the data for now.
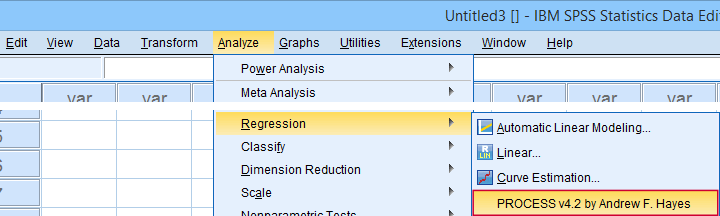
SPSS PROCESS Dialogs
First off, make sure you have PROCESS installed as covered in SPSS PROCESS Macro Tutorial. After opening our data in SPSS, let's navigate to
![]()
![]() as shown below.
as shown below.
For a simple mediation analysis, we fill out the PROCESS dialogs as shown below.
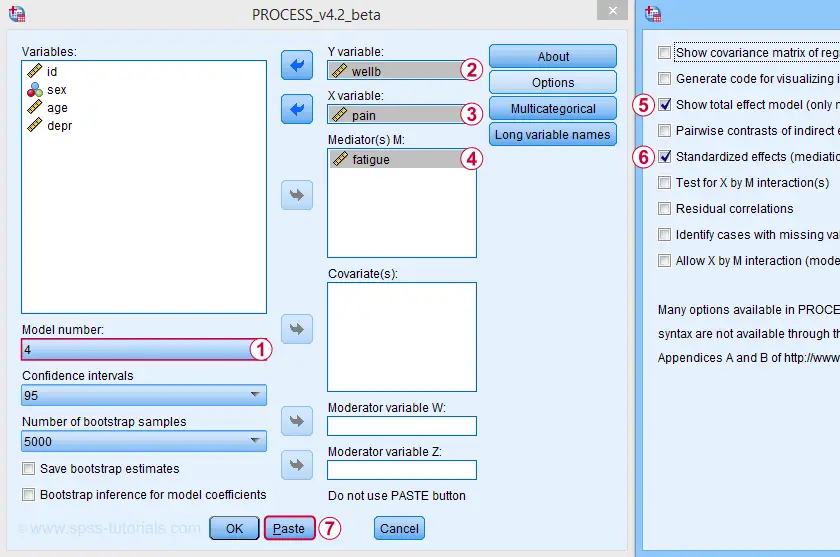
After completing these steps, you can either
- click “Ok” and just run the analysis;
- click “Paste” and run the (huge) syntax that's pasted or;
- click “Paste”, rearrange the syntax and then run it.
We discussed this last option in SPSS PROCESS Macro Tutorial. This may take you a couple of minutes but it'll pay off in the end. Our final syntax is shown below.
set mdisplay tables.
*READ PROCESS DEFINITION.
insert file = 'd:/downloaded/DEFINE-PROCESS-42.sps'.
*RUN PROCESS MODEL 4 (SIMPLE MEDIATION).
!PROCESS
y=wellb
/x=pain
/m=fatigue
/stand = 1 /* INCLUDE STANDARDIZED (BETA) COEFFICIENTS */
/total = 1 /* INCLUDE TOTAL EFFECT MODEL */
/decimals=F10.4
/boot=5000
/conf=95
/model=4
/seed = 20221227. /* MAKE BOOTSTRAPPING REPLICABLE */
SPSS PROCESS Output
Let's first look at path \(a\): this is the effect from \(X\) (pain) onto \(M\) (fatigue). We find it in the output if we look for OUTCOME VARIABLE fatigue as shown below.
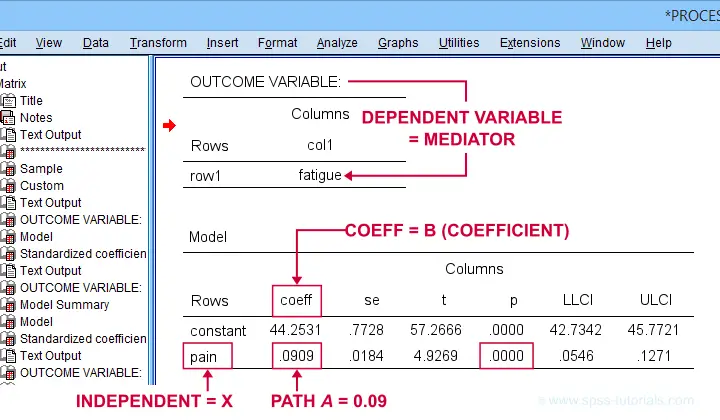
For path \(a\), b = 0.09, p < .001: on average, higher pain scores are associated with more fatigue and this is highly statistically significant. This outcome is as expected if our mediation model is correct.
SPSS PROCESS Output - Paths B and C’
Paths \(b\) and \(c\,'\) are found in a single table. It's the one for which OUTCOME VARIABLE is \(Y\) (well-being) and includes b-coefficients for both \(X\) (pain) and \(M\) fatigue.
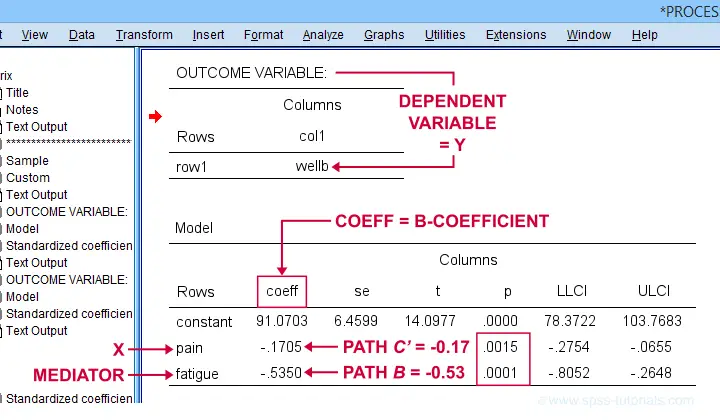
Note that path \(b\) is highly significant, as expected from our mediation hypotheses. Path \(c\,'\) (the direct effect) is also significant but our mediation model does not require this.
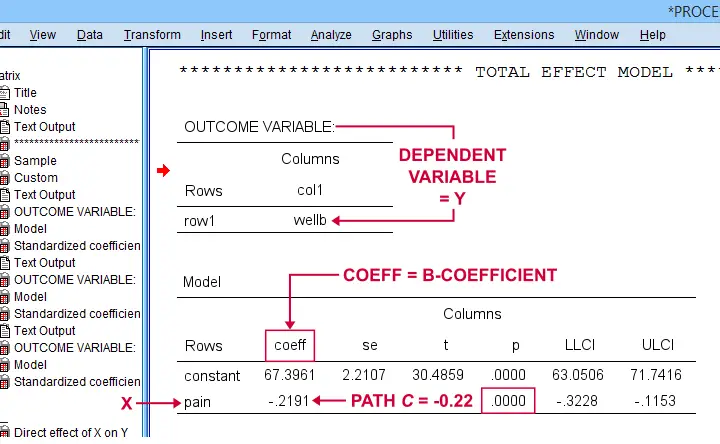
SPSS PROCESS Output - Path C
Some (but not all) authors also report the total effect, path \(c\). It is found in the table that has OUTCOME VARIABLE \(Y\) (well-being) that does not have a b-coefficient for the mediator.
Mediation Summary Diagram & Conclusion
The 4 main paths we examined thus far suffice for a classical mediation analysis. We summarized them in the figure below.
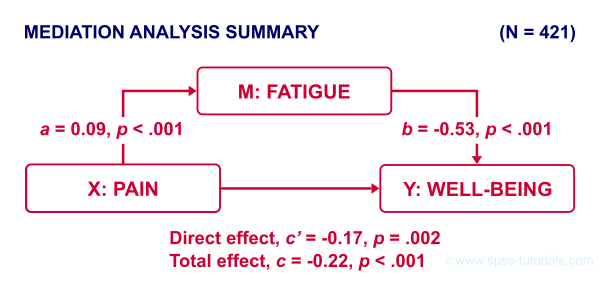
As hypothesized, paths \(a\) and \(b\) are both significant. Also note that direct effect is closer to zero than the total effect. This makes sense because the (negative) direct effect is the (negative) total effect minus the (negative) indirect effect.
A final point is that the direct effect is still significant: the indirect effect only partly accounts for the relation from pain onto well-being. This is known as partial mediation. A careful conclusion could thus be that
the effect from pain onto well-being
is partially mediated by fatigue.
Indirect Effect and Index of Mediation
Thus far, we established mediation by examining paths \(a\) and \(b\) separately. A more modern approach, however, focuses mostly on the entire indirect effect which is simply
$$\text{indirect effect } ab = a \cdot b$$
For our example, \(ab\) is the change in \(Y\) (well-being) associated with a 1-unit increase in \(X\) pain through \(M\) (fatigue). This indirect effect is shown in the table below.
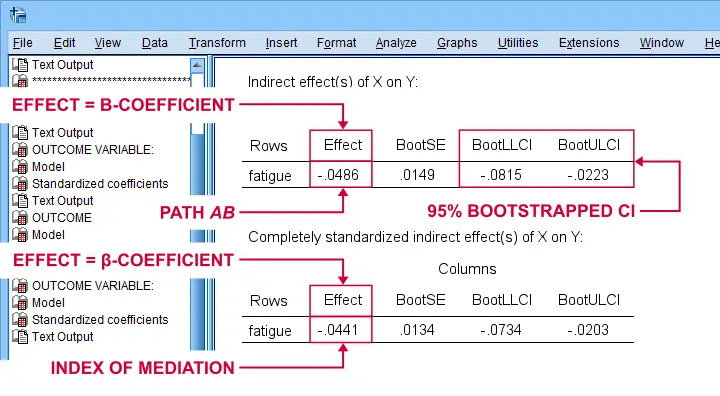
Note that PROCESS does not compute any p-value or confidence interval (CI) for \(ab\). Instead, it estimates a CI by bootstrapping. This CI may be slightly different in your output because it's based on random sampling.
Importantly, the 95% CI [-0.08, -0.02] does not contain zero. This tells us that p < .05 even though we don't have an exact p-value. An alternative for bootstrapping that does come up with a p-value here is the Sobel test.
PROCESS also reports the standardized b-coefficient for \(ab\). This is usually denoted as β and is completely unrelated to (1 - β) or power in statistics. This number, 0.04, is known as the index of mediation and is often interpreted as an effect size measure.
A huge stupidity in this table is that b is denoted as “Effect” rather than “coeff” as in the other tables. For adding to the confusion, “Effect” refers to either b or β. Denoting b as b and β as β would have been highly preferable here.
APA Reporting Mediation Analysis
Mediation analysis is often reported as separate regression analyses: “the first step of our analysis showed that the effect of pain on fatigue was significant, b = 0.09, p < .001...” Some authors also include t-values and degrees of freedom (df) for b-coefficients. For some dumb reason, PROCESS does not report degrees of freedom but you can compute them as
$$df = N - k - 1$$
where
- \(N\) denotes the total sample size (N = 421 in our example) and
- \(k\) denotes the number of predictors in the model (1 or 2 in our example).
Like so, we could report “the second step of our analysis showed that the effect of fatigue on well-being was also significant, b = -0.53, t(419) = -3.89, p < .001...”
Final Notes
First off, mediation is inherently a causal model: \(X\) causes \(M\) which, in turn, causes \(Y\). Nevertheless, mediation analysis does not usually support any causal claims. A rare exception could be \(X\) being a (possibly dichotomous) manipulation variable. In most cases, however, we can merely conclude that
our data do (not) contradict
some (causal) mediation model.
This is not quite the strong conclusion we'd usually like to draw.
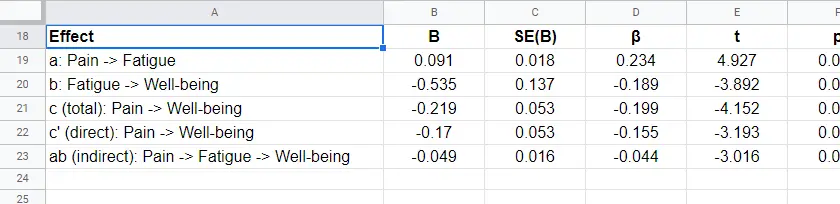
A second point is that I dislike the verbose text reporting suggested by the APA. As shown below, a simple table presents our results much more clearly and concisely.
Lastly, we feel that our example analysis would have been stronger if we had standardized all variables into z-scores prior to running PROCESS. The simple reason is that unstandardized values are uninterpretable for variables such as pain, fatigue and so on. What does a pain score of 60 mean? Low? Medium? High?
In contrast: a pain z-score of -1 means one standard deviation below the mean. If these scores are normally distributed, this is roughly the 16th percentile.
This point carries over to our regression coefficients:
b-coefficients are not interpretable because
we don't know how much a “unit” is
for our (in)dependent variables. Therefore, reporting only β coefficients makes much more sense.
Now, we do have these standardized coefficients in our output. However, most confidence intervals apply to the unstandardized coefficients. This can be fixed by standardizing all variables prior to running PROCESS.
Thanks for reading!
THIS TUTORIAL HAS 1 COMMENT:
By cagatay on May 16th, 2025
thank you very much this is a very good explanation