- Set Up Project Folder and Open Data;
- SPSS Data File Inspection;
- SPSS Categorical Variable Inspection;
- SPSS Metric Variable Inspection;
- Optionally: Edit Data;
- Choose and Run Tables/Charts/Tests.
1. Set Up Project Folder and Open Data
The biggest waste of time and effort in SPSS is probably not keeping projects organized. A related pitfall is not regularly making backup copies of the entire project. Avoiding this starts with setting up a project folder that'll contain all of your data -original and edited-, syntax and output files.
We recommend you never edit your original data and keep it in a safe place. For me, that's usually a subfolder called “ori”, short for “original data”. Make sure that the project contains all files you'd like to backup -and nothing else.
Done setting up a decent project folder? Then let's go and open the data.
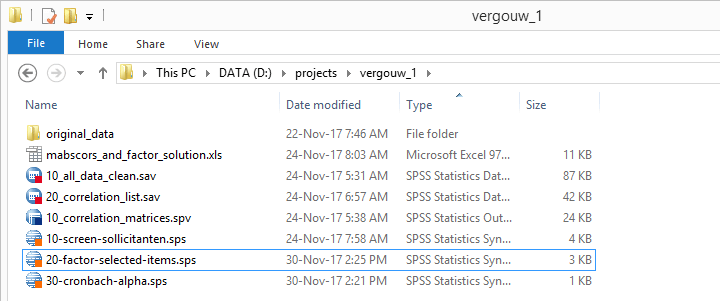 Keeping this project nicely organized saved me way more time than it cost me.
2. SPSS Data File Inspection
At this point we know which variables in our data -possibly all- we're actually going to use. A sound way to proceed from here is inspecting our data visually. Some things we need to know are
- is there a unique case identifier?
- are there excessively long variable names?
- are there any undesired string variables?
- are all variables and values clearly labeled? Is it absolutely clear what everything really means? If not, don't guess. Instead, obtain this information -preferably via email- from whomever is responsible for delivering accurate and complete data to you.
If you encounter any such issues, fix them right away. The sooner you troubleshoot such issues, the less time and effort they'll cost you.
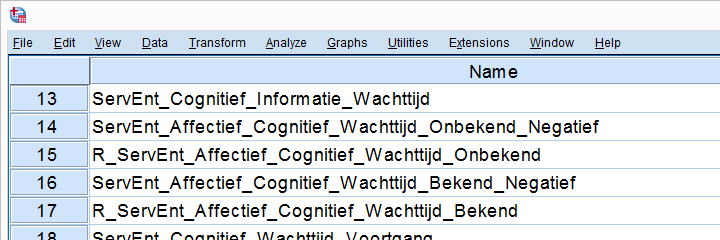 Shortening these variable names and applying variable labels saves more effort than it costs
At this point our data should be technically in order. So what about the contents of our variables? I suggest you carefully check these for categorical variables and metric variables separately.
3. SPSS Categorical Variable Inspection
We inspect categorical variables by
- running frequency tables showing both values and value labels and
- inspecting the corresponding bar charts.
A single line FREQUENCIES command suffices for many variables in one go. Issues we typically look for are:
- are any ordinal variables reversely coded (lower values indicating higher ratings)? If so, see SPSS - What’s the Best Way to Reverse Code Variables?
- should any user missing values be specified?
- are all frequency distributions plausible? That is, do all variables make sense?
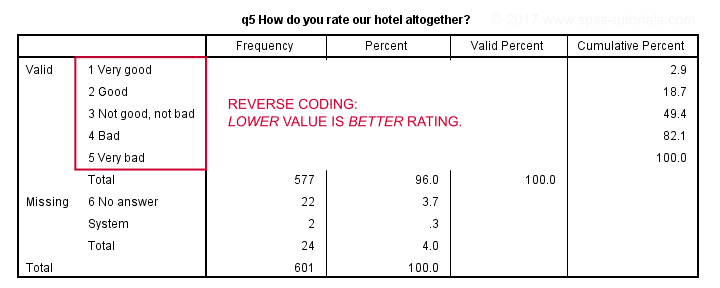 Reverse coded variable - not really wrong but inconvenient nevertheless.
If any such issues are present, try and fix them. If they can't be fixed, perhaps take some notes so you won't have any nasty surprises later on.
4. SPSS Metric Variable Inspection
We inspect metric variables by
- running basic histograms over them and
- inspecting simple DESCRIPTIVES tables.
Note that you can run many histograms with a single line FREQUENCIES command as shown in Creating Histograms in SPSS. Histograms basically tell you all you need to know. Issues to look out for are
- are all distributions plausible? What about the means and standard deviations?
- are there any extreme values -either very large or very small- that must be specified as user missing?
- do any variables have many system missing values?
Next, a basic DESCRIPTIVES table comes in handy for checking the completeness of a set of variables. It'll also allow for a quick comparison of means and standard deviations.
After completing these steps, we can be confident that our data are sound. Nothing incorrect or unusual can mess up any newly created variables or test results anymore. Now -and only now- should we proceed with editing or analyzing our data. As a bonus, we also know what our data basically look like.
5. Optionally: Edit Data
Perhaps your research questions relate to variables that still need to be created or adjusted. Well, this is the moment to do so. Our most read tutorials on common data adjustments are
- SPSS Date Variables Tutorial
- How to Compute Age in SPSS?
- SPSS IF Command
- SPSS RECODE Command
- How to Compute Means in SPSS?
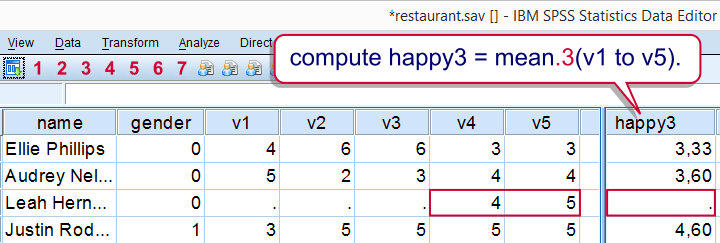 A nice -syntax only- trick for excluding cases with many missings when computing means
Hope those will get you started. Really, do adjust your data if needed. This often results in much nicer output with much less effort.
6. Choose and Run Tables, Charts & Tests
First off, which tables, charts and tests are appropriate is a complicated question that doesn't have a simple answer. Oftentimes, different approaches are equally defensible.
In any case,
the simplest analysis techniques examine each variable separately.
These are called univariate analyses (“univariate” means “for one variable”). As shown below, we should at least distinguish categorical from metric variables.
Minimal Overview Univariate Analyses
| Level | Table | Chart | Test |
|---|---|---|---|
| Categorical | FREQUENCIES | Bar chart frequencies | Binomial test (2 categories) Chi-square goodness-of-fit test (3+ categories) |
| Metric | DESCRIPTIVES | Histogram | One-sample t-test (mean) Kolmogorov-Smirnov test (distribution) |
A next step could be to examine if 2 variables are associated in any way. This involves bivariate analyses (“bivariate” means “for 2 variables”). Distinguishing categorical from metric variables once again, we arrive at the simple overview below.
Minimal Overview Bivariate Association Analyses
| Variable A | Variable B | Table | Chart | Test |
|---|---|---|---|---|
| Categorical | Categorical | CROSSTABS | Stacked bar chart percentages | Chi-square independence test |
| Metric | Categorical | MEANS | Bar chart means by category | Independent samples t-test (2 categories) One-way ANOVA (3+ categories) |
| Metric | Metric | CORRELATIONS | Scatterplot | Correlation test (non directional) Simple linear regression (directional) |
If you properly understand these tests, you'll start to see that most statistical tests are variations on these big 5 tests. For example,
- multiple regression is simple regression with more than 1 predictor;
- logistic regression is just regression with a dichotomous outcome variable;
- the Kruskal-Wallis test is basically a one-way ANOVA on ranked scores. And so on...
Is that all? No, not quite. First off, we only mentioned categorical and metric variables. Ideally, we'd distinguish
- dichotomous variables;
- nominal variables;
- ordinal variables and;
- metric variables.
We don't always need to treat these all separately but doing so results in a much more complete overview. We're working on it but it'll take another while.
For now, perhaps consult Which Statistical Test Should I Use?, part of which is shown below. Unfortunately, this overview is limited to statistical significance tests and does not suggest which tables and charts to use.
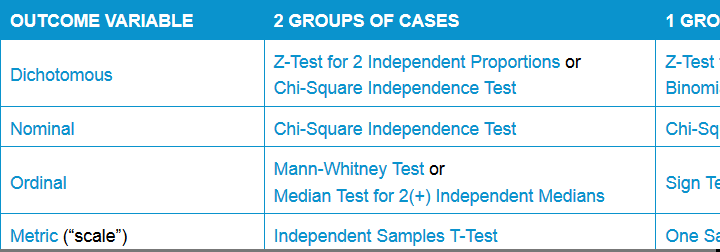 Simple overview statistical comparison tests
Thanks for reading!
THIS TUTORIAL HAS 11 COMMENTS:
By David Marso on October 11th, 2018
Well done. I always create sub folders to keep syntax,data and output in separate places. I have an empty skeleton which I can just copy into the root project folder. These folders also have a subfolder called old.
By Brian Lwanga on April 23rd, 2019
It has been an eye opener I'm learning this for the first time. I would like to know even more from you...
By Ruben Geert van den Berg on April 23rd, 2019
Hi Brian, thanks for the compliment!
Keep an eye on our facebook page as we'll publish most of our new work there.
Thanks!
SPSS tutorials
By Stefania on January 28th, 2020
Dear Ruben,
I am preparing an essay and a MSc exam on this and your blog is simply what I was looking for!
Thank you so much! Hope it will get me trough essay and exam! Stefania - Italy
By abreham on February 14th, 2020
Thank you