- Univariate Tests
- Within-Subjects Tests
- Between-Subjects Tests
- Association Measures
- Prediction Analyses
- Classification Analyses
Summary
Finding the appropriate statistical test is easy if you're aware of
- the basic type of test you're looking for and
- the measurement levels of the variables involved.
For each type and measurement level, this tutorial immediately points out the right statistical test. We'll also briefly define the 6 basic types of tests and illustrate them with simple examples.
1. Overview Univariate Tests
| MEASUREMENT LEVEL | NULL HYPOTHESIS | TEST |
|---|---|---|
| Dichotomous | Population proportion = x? | Binomial test Z-test for 1 proportion |
| Categorical | Population distribution = f(x)? | Chi-square goodness-of-fit test |
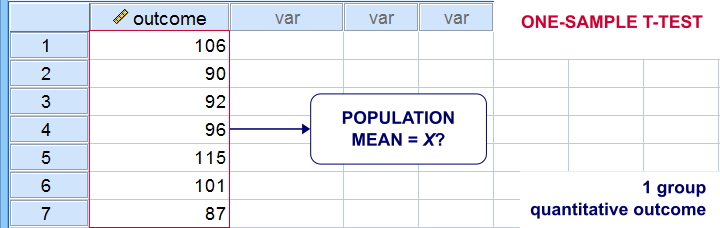
| Quantitative | Population mean = x? | One-sample t-test |
| Population median = x? | Sign test for 1 median | |
| Population distribution = f(x)? | Kolmogorov-Smirnov test Shapiro-Wilk test |
Univariate Tests - Quick Definition
Univariate tests are tests that involve only 1 variable. Univariate tests either test if
- some population parameter -usually a mean or median- is equal to some hypothesized value or
- some population distribution is equal to some function, often the normal distribution.
A textbook example is a one sample t-test: it tests if a population mean -a parameter- is equal to some value x. This test involves only 1 variable (even if there's many more in your data file).
2. Overview Within-Subjects Tests
| MEASUREMENT LEVEL | 2 VARIABLES | 3+ VARIABLES |
|---|---|---|
| DICHOTOMOUS | McNemar test Z-test for dependent proportions | Cochran Q test |
| NOMINAL | Marginal homogeneity test | (Not available) |
| ORDINAL | Wilcoxon signed-ranks test Sign test for 2 related medians | Friedman test |
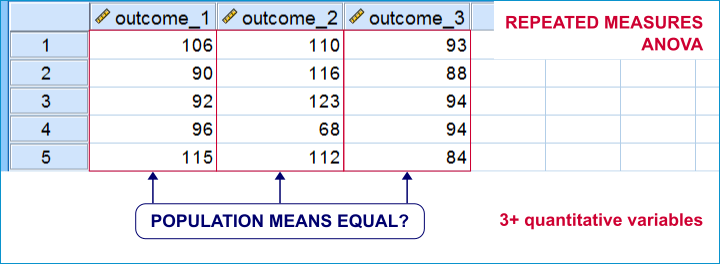
| QUANTITATIVE | Paired samples t-test | Repeated measures ANOVA |
Within-Subjects Tests - Quick Definition
Within-subjects tests compare 2+ variables
measured on the same subjects (often people).
An example is repeated measures ANOVA: it tests if 3+ variables measured on the same subjects have equal population means.
Within-subjects tests are also known as
- paired samples tests (as in a paired samples t-test) or
- related samples tests.
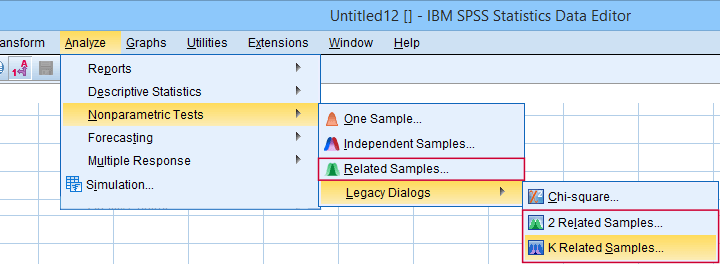 “Related samples” refers to within-subjects and “K” means 3+.
3. Overview Between-Subjects Tests
| OUTCOME VARIABLE | 2 SUBPOPULATIONS | 3+ SUBPOPULATIONS |
|---|---|---|
| Dichotomous | Z-test for 2 independent proportions | Chi-square independence test |
| Nominal | Chi-square independence test | Chi-square independence test |
| Ordinal | Mann-Whitney test (mean ranks) Median test for 2+ independent medians | Kruskal-Wallis test (mean ranks) Median test for 2+ independent medians |
| Quantitative | Independent samples t-test (means) Levene's test (variances) | One-way ANOVA (means) Levene's test (variances) |
Between-Subjects Tests - Quick Definition
Between-subjects tests examine if 2+ subpopulations
are identical with regard to
- a parameter (population mean, standard deviation or proportion) or
- a distribution.
The best known example is a one-way ANOVA as illustrated below. Note that the subpopulations are represented by subsamples -groups of observations indicated by some categorical variable.
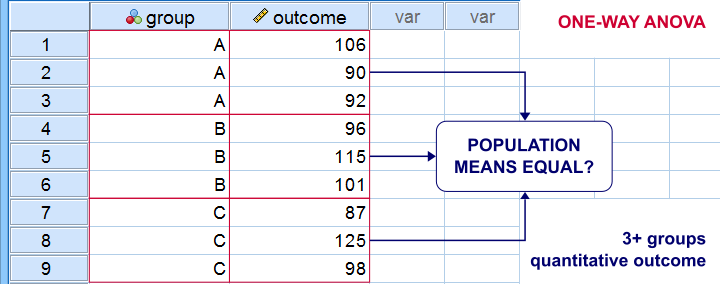
“Between-subjects” tests are also known as “independent samples” tests, such as the independent samples t-test. “Independent samples” means that subsamples don't overlap: each observation belongs to only 1 subsample.
4. Overview Association Measures
| (VARIABLES ARE) | QUANTITATIVE | ORDINAL | NOMINAL | DICHOTOMOUS |
|---|---|---|---|---|
| QUANTITATIVE | Pearson correlation | |||
| ORDINAL | Spearman correlation Kendall’s tau Polychoric correlation | Spearman correlation Kendall’s tau Polychoric correlation | ||
| NOMINAL | Eta squared | Cramér’s V | Cramér’s V | |
| DICHOTOMOUS | Point-biserial correlation Biserial correlation | Spearman correlation Kendall’s tau Polychoric correlation | Cramér’s V | Phi-coefficient Tetrachoric correlation |
Association Measures - Quick Definition
Association measures are numbers that indicate
to what extent 2 variables are associated.
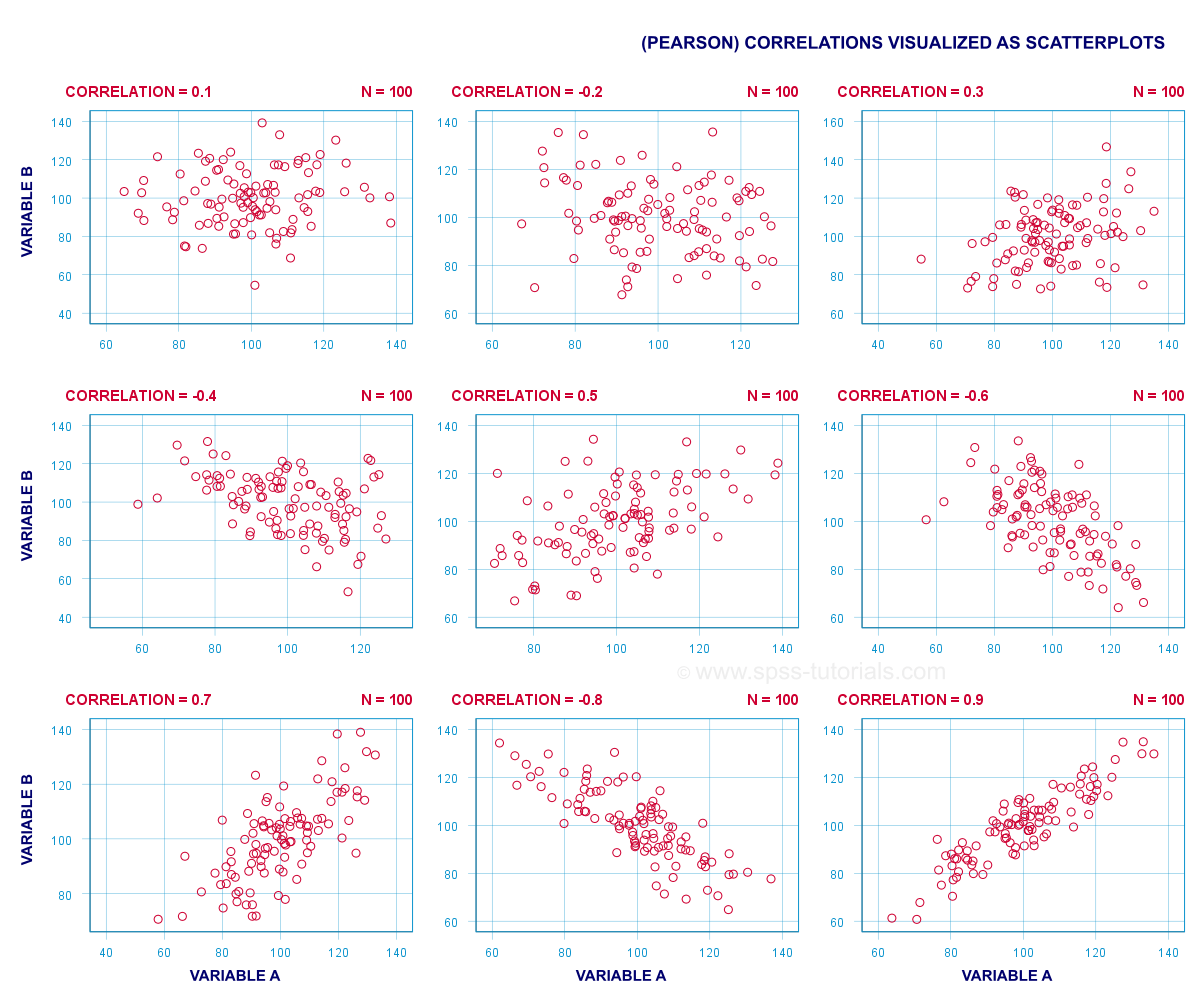
The best known association measure is the Pearson correlation: a number that tells us to what extent 2 quantitative variables are linearly related. The illustration below visualizes correlations as scatterplots.
5. Overview Prediction Analyses
| OUTCOME VARIABLE | ANALYSIS |
|---|---|
| Quantitative | (Multiple) linear regression analysis |
| Ordinal | Discriminant analysis or ordinal regression analysis |
| Nominal | Discriminant analysis or nominal regression analysis |
| Dichotomous | Logistic regression |
Prediction Analyses - Quick Definition
Prediction tests examine how and to what extent
a variable can be predicted from 1+ other variables.
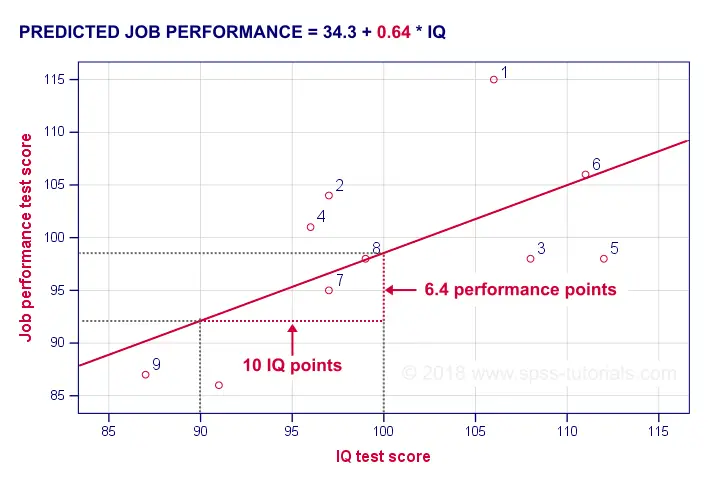
The simplest example is simple linear regression as illustrated below.
Prediction analyses sometimes quietly assume causality: whatever predicts some variable is often thought to affect this variable. Depending on the contents of an analysis, causality may or may not be plausible. Keep in mind, however, that the analyses listed below don't prove causality.
6. Classification Analyses
Classification analyses attempt to identify and
describe groups of observations or variables.
The 2 main types of classification analysis are
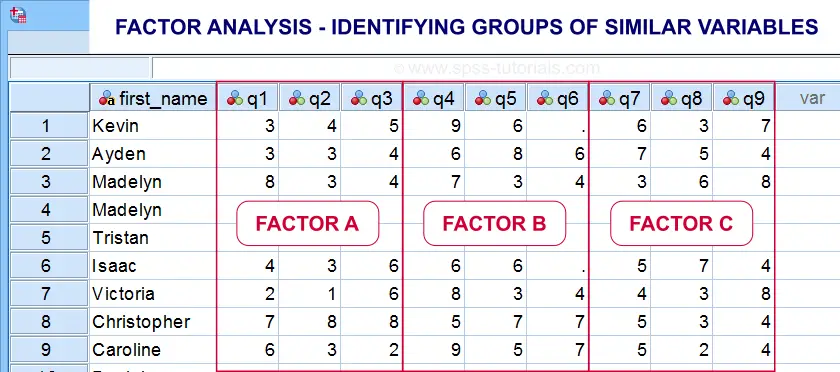
- factor analysis for finding groups of variables (“factors”) and
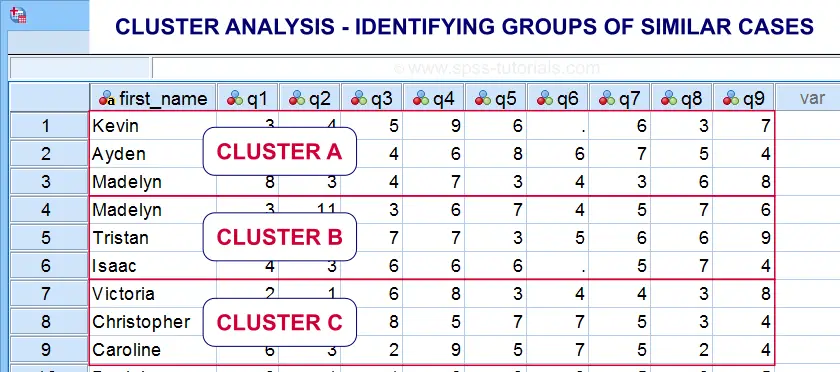
- cluster analysis for finding groups of observations (“clusters”).
Factor analysis is based on correlations or covariances. Groups of variables that correlate strongly are assumed to measure similar underlying factors -sometimes called “constructs”. The basic idea is illustrated below.
Cluster analysis is based on distances among observations -often people. Groups of observations with small distances among them are assumed to represent clusters such as market segments.
Right. So that'll do for a basic overview. Hope you found this guide helpful! And last but not least,
thanks for reading!
THIS TUTORIAL HAS 18 COMMENTS:
By Julio on February 5th, 2020
Excelent for beginners !
By Ruben Geert van den Berg on February 6th, 2020
Thanks for the compliment! Happy to hear you liked it!
By Jon K Peck on February 6th, 2020
Don't forget polyserial correlation for continuous (quantitative) with ordinal.
And for classification, there are lots of other good choices such as trees and support vector machines
By Ruben Geert van den Berg on February 6th, 2020
Thanks for the suggestions!
I was planning to write a separate overview on association measures in order to cover them a little more in-depth but it'll take at least some more weeks.
With "trees", are you referring to CHAID and similar procedures? IMHO, these fall more into prediction than classification.
P.s. "quantitative" is not always "continuous" as in number of children/cars in a household. Strictly, even amounts of dollars are not continuous as there's no value between $0.00 and $0.01. I kinda feel "continuous" should only be used for truly continuous variables such as length/weight and so on.
By Jon K Peck on February 6th, 2020
Statistics calls "quantitative" "scale". And what do you have against 2.5 children? :-)
Trees - CHAID et al, is a classification procedure with a categorical dependent variable, but, of course, it's also doing prediction as also with SVM or logistic regression.